 Downcoded
51 Markets Hit the Wage Index Cap, and Everyone Paid
The FY 2027 SNF wage index falls more than 5% in 51 of 468 areas, so Medicare's permanent cap holds every facility in them at exactly a 5% drop. Statute makes that cap budget neutral, which means the rest of the country funds it, and the deferred cut comes back next October.
CMS slotted the FY 2027 SNF Pricer into Thursday's MLN Connects with a one-line reminder attached: "Effective FY 2023, CMS applies a permanent 5% cap on any decrease to a provider's wage index from its wage index in the prior year."
The wage index tables that shipped with the final rule carry a matching note, and it is the more useful of the two.
The published values are uncapped. What a facility actually gets paid, CMS says, "may be higher."
"How many markets are being carried by that cap, and who is carrying them?"
So we pulled CMS's final Table A and Table B for FY 2027, pulled the same two tables for FY 2026, matched them on area code, and diffed all 468 wage areas: the 417 urban CBSAs plus the statewide rural areas.
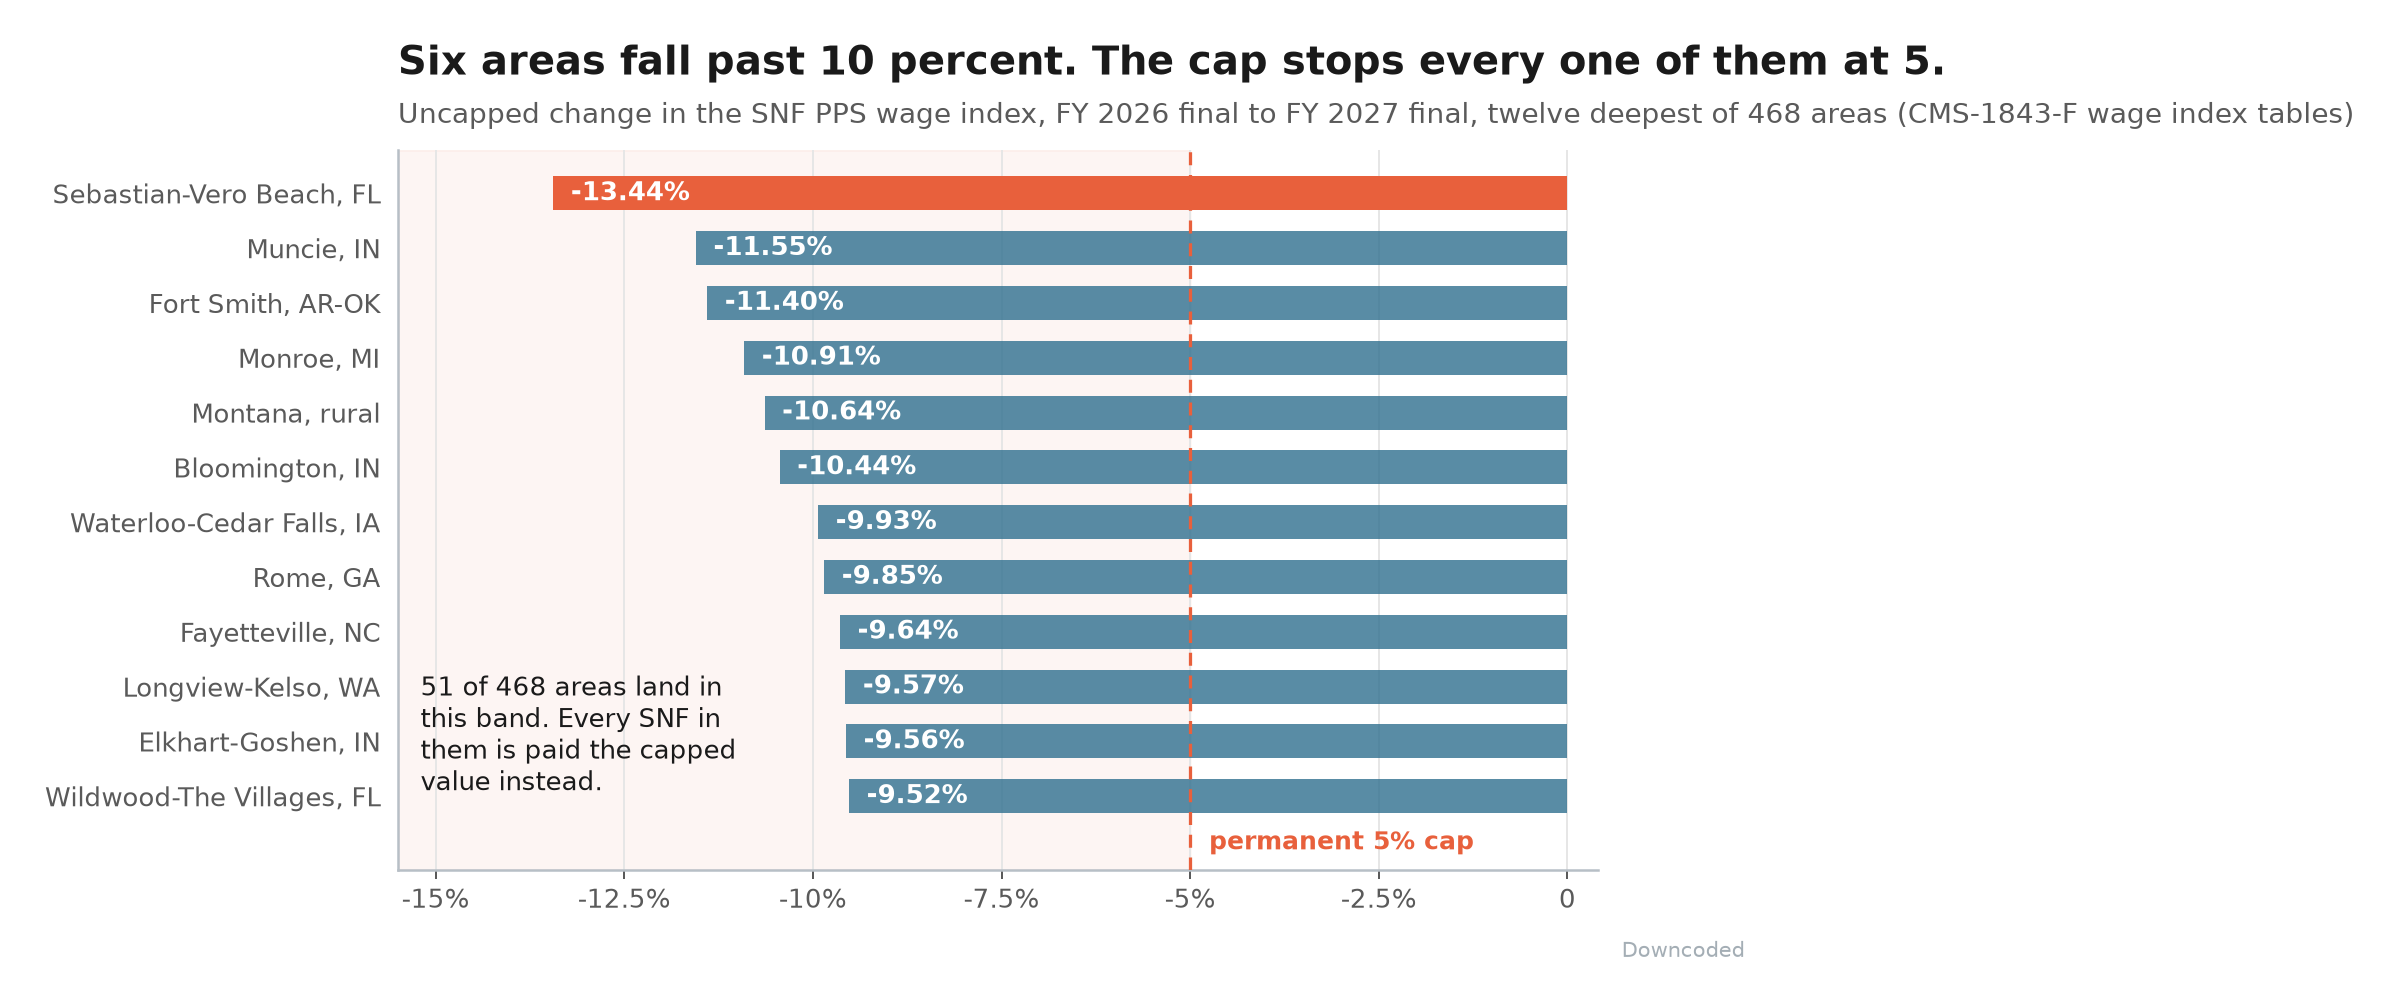
51 of them fall more than 5 percent (chart below).
The middle is boring. The tail is not.
254 areas down, 212 up, two flat, median move -0.43%. That is the wage index doing exactly what a redistribution is supposed to do.
Then there is Sebastian-Vero Beach, which goes 1.0152 to 0.8788 in a single year. Down 13.44%.
Muncie -11.55%, Fort Smith -11.40%, Monroe -10.91%, rural Montana -10.64%, Bloomington -10.44%. Six areas past ten percent.
The FY 2027 labor-related share is 72.0%, so the wage adjustment on a rate component is 0.72 x WI + 0.28. Run Vero Beach through it.
Uncapped, the payment factor drops 9.71%. Held at 0.9644 by the cap, it drops 3.62%.
Layer the 2.4 percent market basket update on top and a Vero Beach SNF lands at -1.3% for FY 2027 where it would otherwise land at -7.5%. The cap is worth 6.76% of Part A revenue to that building this year, and an average of 1.93% across all 51 capped areas.
(That math assumes the facility wasn't itself capped in FY 2026. If it was, its base is higher and every number here is a floor.)
Okay, so who covers it
Section 1888(e)(4)(G)(ii) requires the geographic adjustment to be budget neutral, and commenters asked CMS to run the cap outside that requirement anyway, in their words "to stabilize provider reimbursement and avoid further unexpected reductions for other providers."
The answer in the final rule is one sentence: "we do not believe that the permanent 5-percent cap policy for the SNF wage index should be applied in a non-budget-neutral manner."
Which puts the cost somewhere specific. The FY 2027 wage index budget neutrality factor is 0.9989, applied to every SNF rate in the country, and the money to hold up those 51 markets is inside it.
The cap is also one-sided, worth noticing. 50 areas rise more than 5 percent this year and keep all of it: Decatur, IL at +18.11%, Kingston, NY at +16.78%, Grand Forks at +15.47%.
Protection on the way down, free rein on the way up, and a factor applied to everybody to make the arithmetic close.
Three Octobers to Absorb One Year
Read the file note once more. The 5 percent limit runs from the provider's final FY 2026 wage index value.
This year's capped number becomes next year's starting point.
Vero Beach is paid 0.9644 in FY 2027. If its underlying wage data never moves again, it is paid 0.9162 in FY 2028, then 0.8704 in FY 2029, which is where the FY 2027 table already has it.
Three fiscal years to absorb one year of movement.
Any area down more than 9.75 percent gets capped a second time in FY 2028 on today's data alone, before a single new cost report lands. Eight of the 51 clear that line.
Final Thoughts
None of this is an argument against the cap. A 13 percent one-year swing in a market's wage index says more about which hospitals filed which cost reports than about what a nursing home in Indian River County pays its aides, and smoothing that is the right instinct.
The part worth carrying into the FY 2027 budget is the sequencing. If you operate in one of the 51, the uncapped number in the table is your destination and the cap is only the schedule you arrive on, so model against the table value and treat the next two Octobers as known. If you operate anywhere else, you are paying for that schedule inside a factor of 0.9989, which is a cheap way to buy a neighbor three years of runway.
Thanks for reading.