 Downcoded
CMS Already Published the Error Rate on What You Bill
The Medicare Learning Network keeps 57 service-line denial dossiers, each one carrying the 2024 improper payment rate, the projected dollars, and the exact mix of reasons the money failed. Two of them surfaced in MLN Connects this month. The other 55 have been sitting there the whole time.
Medicare's 2024 improper payment rate on comprehensive outpatient rehab is 45.4%. On lenses it is 65.9%. On cardiac pacemakers it is 2.4%.
All three come from the same shelf, and you can read the whole shelf this afternoon without a login.
The Medicare Provider Compliance Tips library is a Medicare Learning Network product: 57 service-line pages, each one a short dossier on how that service loses money. Every page names the affected providers, points at the governing NCD or LCD, gives the improper payment rate and the projected dollars from the CERT supplemental data, breaks out the reasons those claims failed as percentages, and then lists what to do about it.
Every one of the 57 is now on the 2024 reporting period. The pages were refreshed in batches between February and June of this year.
Two of them turned up in MLN Connects in consecutive weeks. On August 20 CMS pushed the CORF tip with its 45.4% rate and $10.8 million projected. On August 27 it pushed the dermatology guidance on billing E/M alongside minor surgical procedures, citing an OIG finding that roughly 61.5% of Medicare dermatology E/M claims in 2019 and 2020 carried a same-day minor procedure from the same dermatologist.
"If the error rate on your service line is already published, what exactly is anyone guessing about?"
What One Of These Actually Contains
Take the CORF page, since CMS just advertised it.
The rate is 45.4% and the projected improper payment is $10.8 million. Then the part that earns the click: insufficient documentation accounted for 84.3% of those improper payments, incorrect coding for 1.2%, and other errors for 14.5%.
That is a completely different work order than a 45% error rate on its own implies. Nobody in that service line needs a coding audit. They need one clinical record per patient with the initial assessment, the reassessments, and the plan of treatment in it.
Sort It Twice, Get Two Answers
Fifty-five of the 57 tips publish a single comparable rate. The two that do not are worth knowing about: annual wellness visits publishes an overpayment rate instead (24.5%, $307.5 million), and echography and sonography publishes three separate rates rather than one.
Across those 55, the spread runs from 0% to 65.9%. 23 of them sit at or above a 25% improper payment rate, and 4 sit at or above 50%: lenses at 65.9%, pneumatic compression devices at 61.5%, surgical dressings at 57.6%, spinal orthoses at 54.4%.
Sorting by rate and sorting by dollars produce almost unrelated lists (chart below).
Lenses tops the rate table on a $15.7 million pool. Skilled nursing sits at a mild 17.9% on $5.6 billion, and E/M runs 10.3% across all codes while still carrying $3.9 billion, the second largest pool on the shelf.
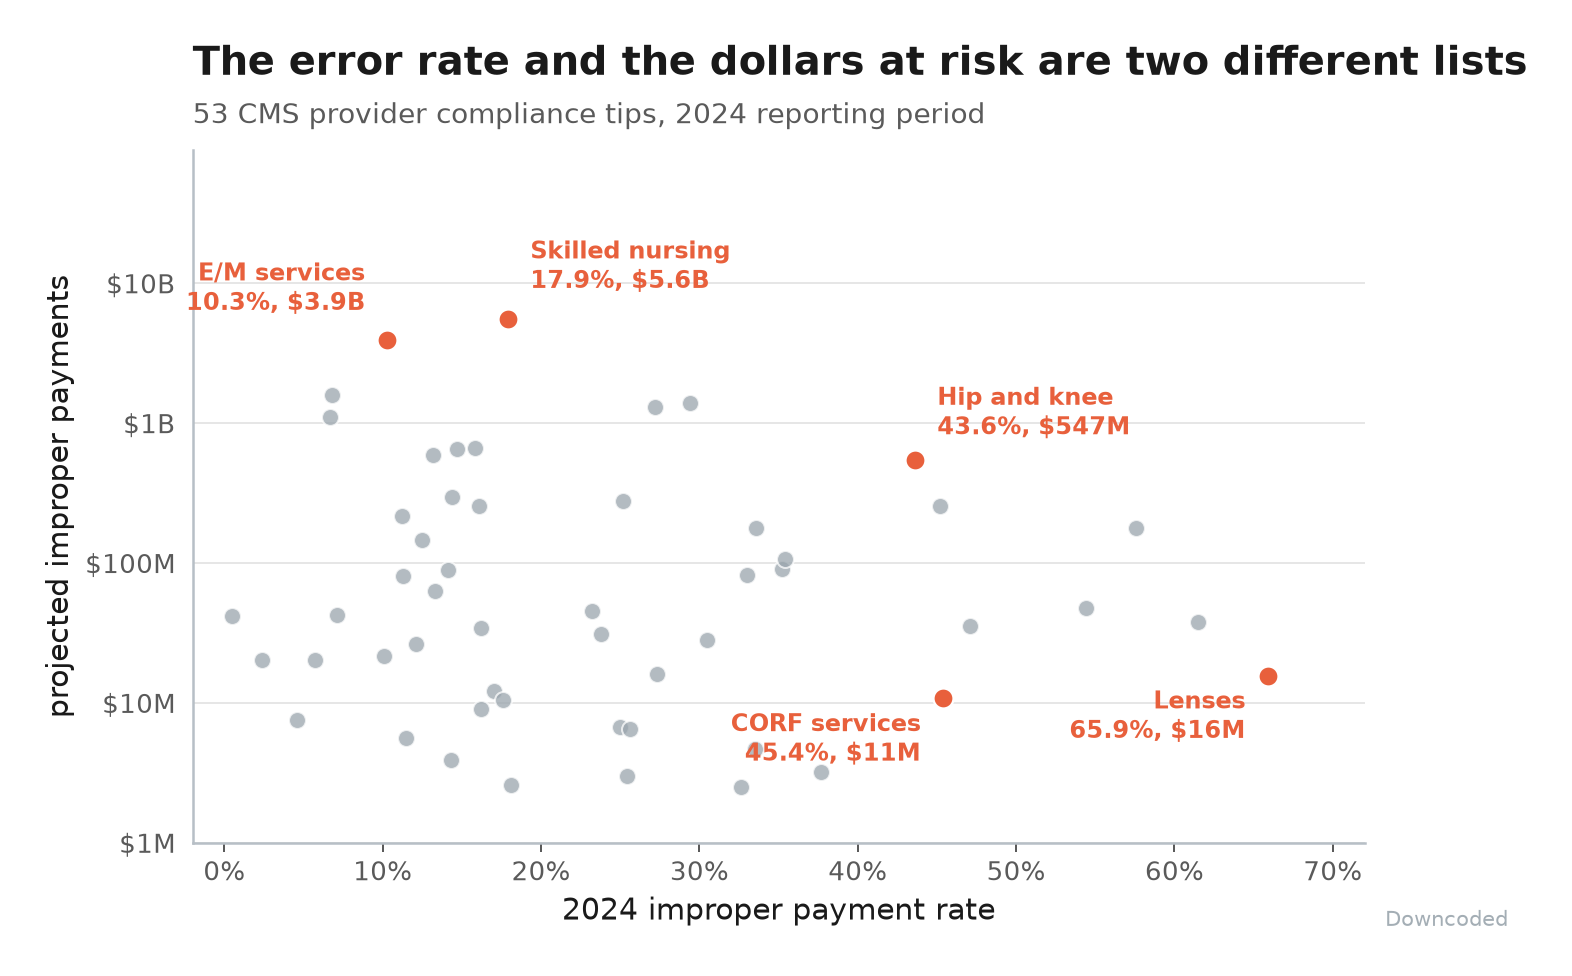
If you only look at the top of the rate table you will spend the quarter on lenses. If you only look at the dollars you will never notice that hip and knee replacement is failing 43.6% of the time on $546.7 million.
What Actually Fails
Forty-seven of the tips publish a denial-reason breakdown, and 34 of those put insufficient documentation at half or more of the improper payments.
Chiropractic is at 95.5%. Cataract services 90.6%, physical therapy 88.6%, other lab tests 87.7%.
So the dominant failure mode across Medicare's biggest error pools is paperwork, which puts the fix with HIM and clinical documentation (chart below).
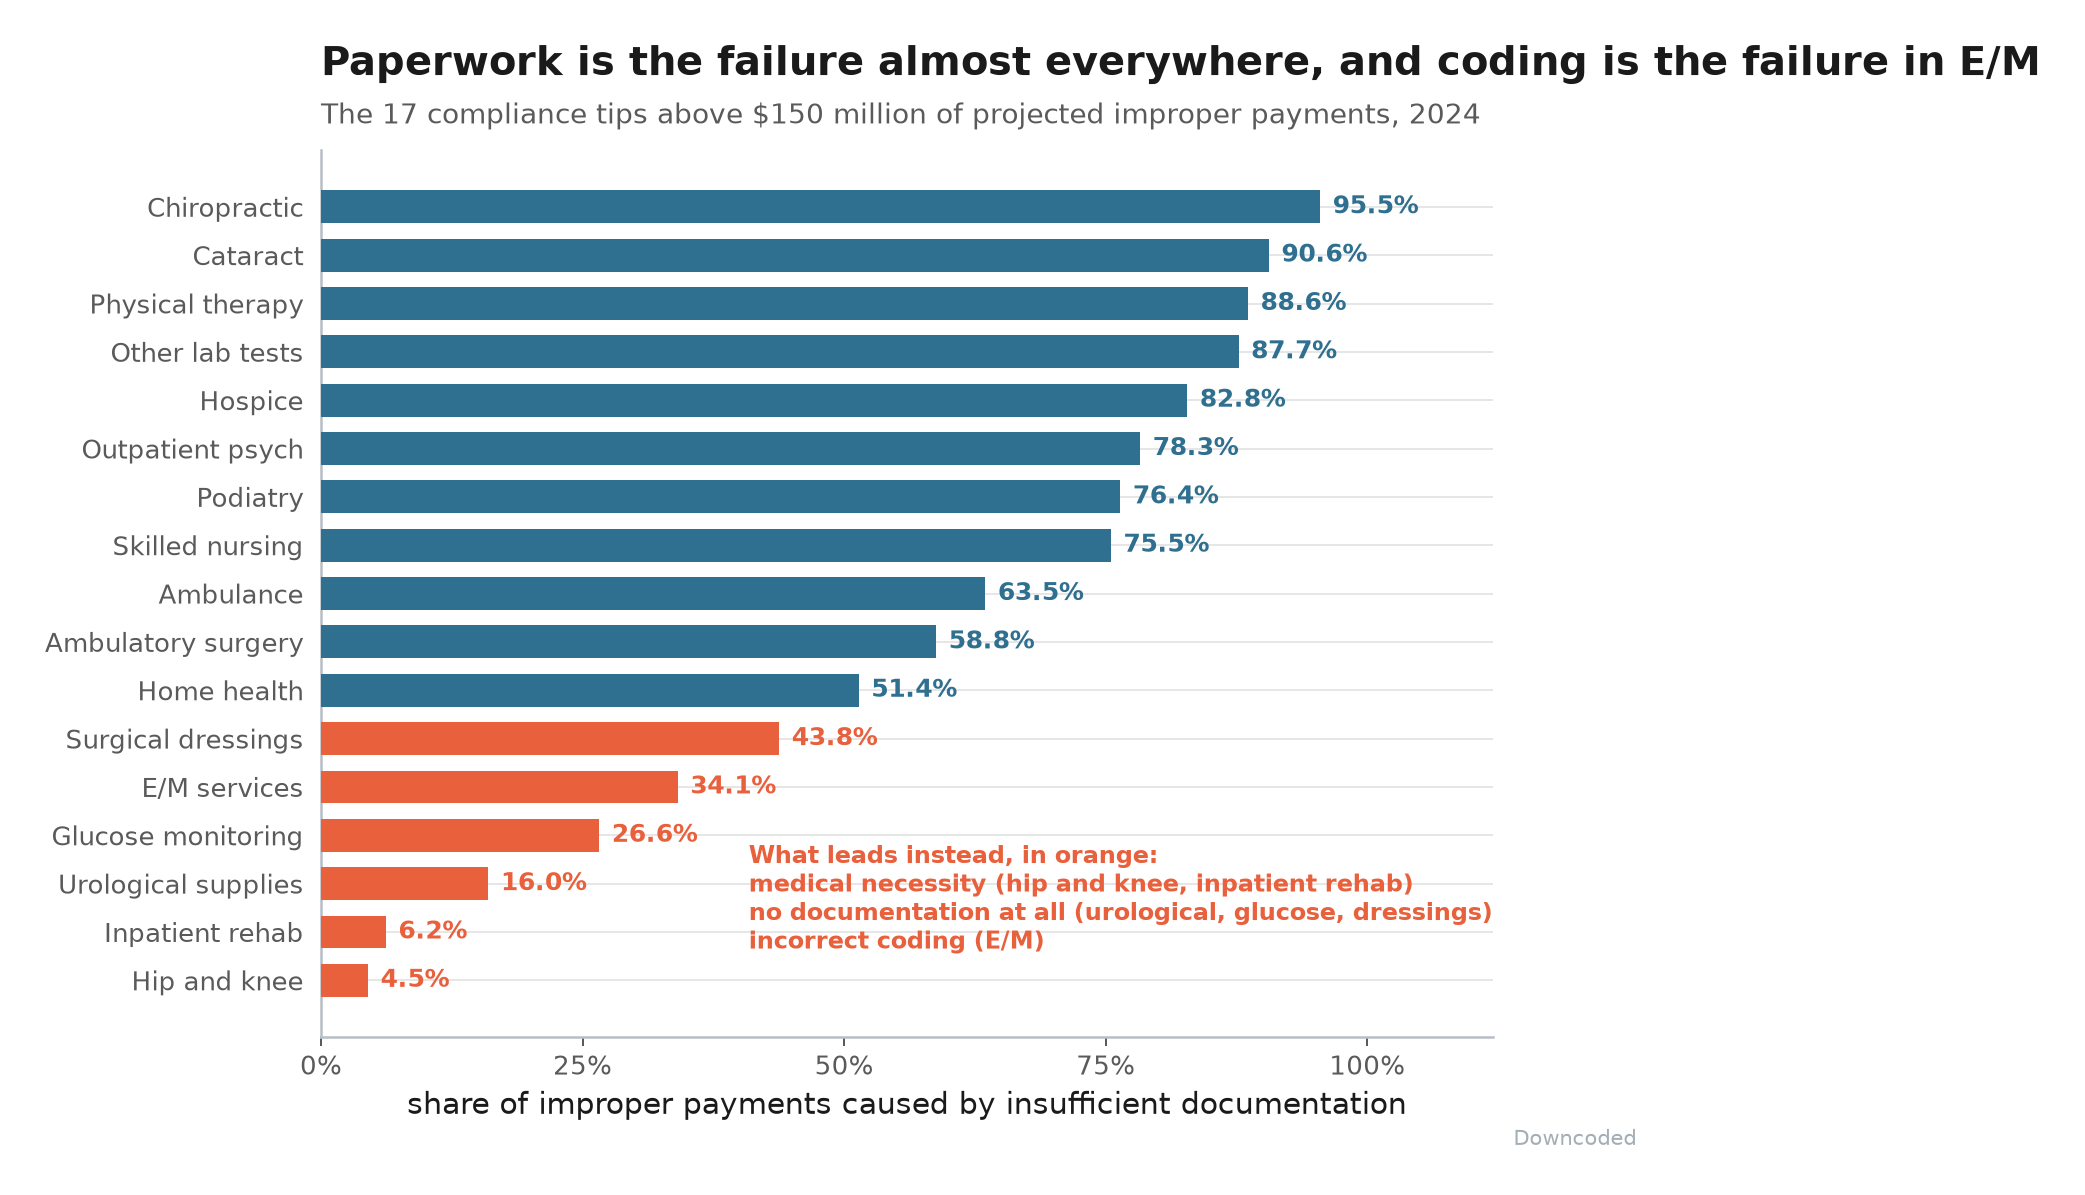
Then there are the six exceptions among the seventeen largest pools, and they are the ones worth circling:
- Medical necessity leads on hip and knee replacement (92.8%) and inpatient rehab (93.8%). That is a utilization review conversation.
- No documentation at all, meaning nothing was produced in response to the request, leads on urological supplies (80.2%), glucose monitoring supplies (67.6%) and surgical dressings (48.6%). That is a records-response process failure, and it is the cheapest thing on this page to fix.
- Incorrect coding leads on E/M at 49.1%, with insufficient documentation second at 34.1%.
That last one matters most to a physician group, because E/M is where the $3.9 billion is and it is the one line among the biggest pools where the fix genuinely lives with the coders.
The Ones That Went To Zero
Orthopedic footwear was at 100% in the 2023 data with $4.3 million projected. In the 2024 data it is at 0%, and the tip says so plainly: no denial reasons were listed in the 2024 CERT report for orthopedic footwear. Respiratory assist devices did the same thing, from 9.9% and $8.9 million down to zero.
To be fair, a zero in a CERT sample this small is thin evidence of anything, and the tips do not publish sample sizes. Those are also the two pages where CMS prints the prior year's rate next to the current one, which is the closest thing on the shelf to a trend line.
Final Thoughts
None of this is new data. It is the CERT supplemental file, which has been public for years, cut into 57 pieces and written up in the language of the department that has to act on it.
What changed is that CMS is now walking the library out one service line at a time in MLN Connects, which means the next one lands in a week or two and it might be yours. The useful move is to pull the tips for your top service lines, read the denial-reason percentages rather than the headline rate, and hand each one to whichever department the percentages actually implicate.
The audit contractors are reading from the same shelf.
Thanks for reading.