 Downcoded
CMS Just Published Everyone's ABA Rates
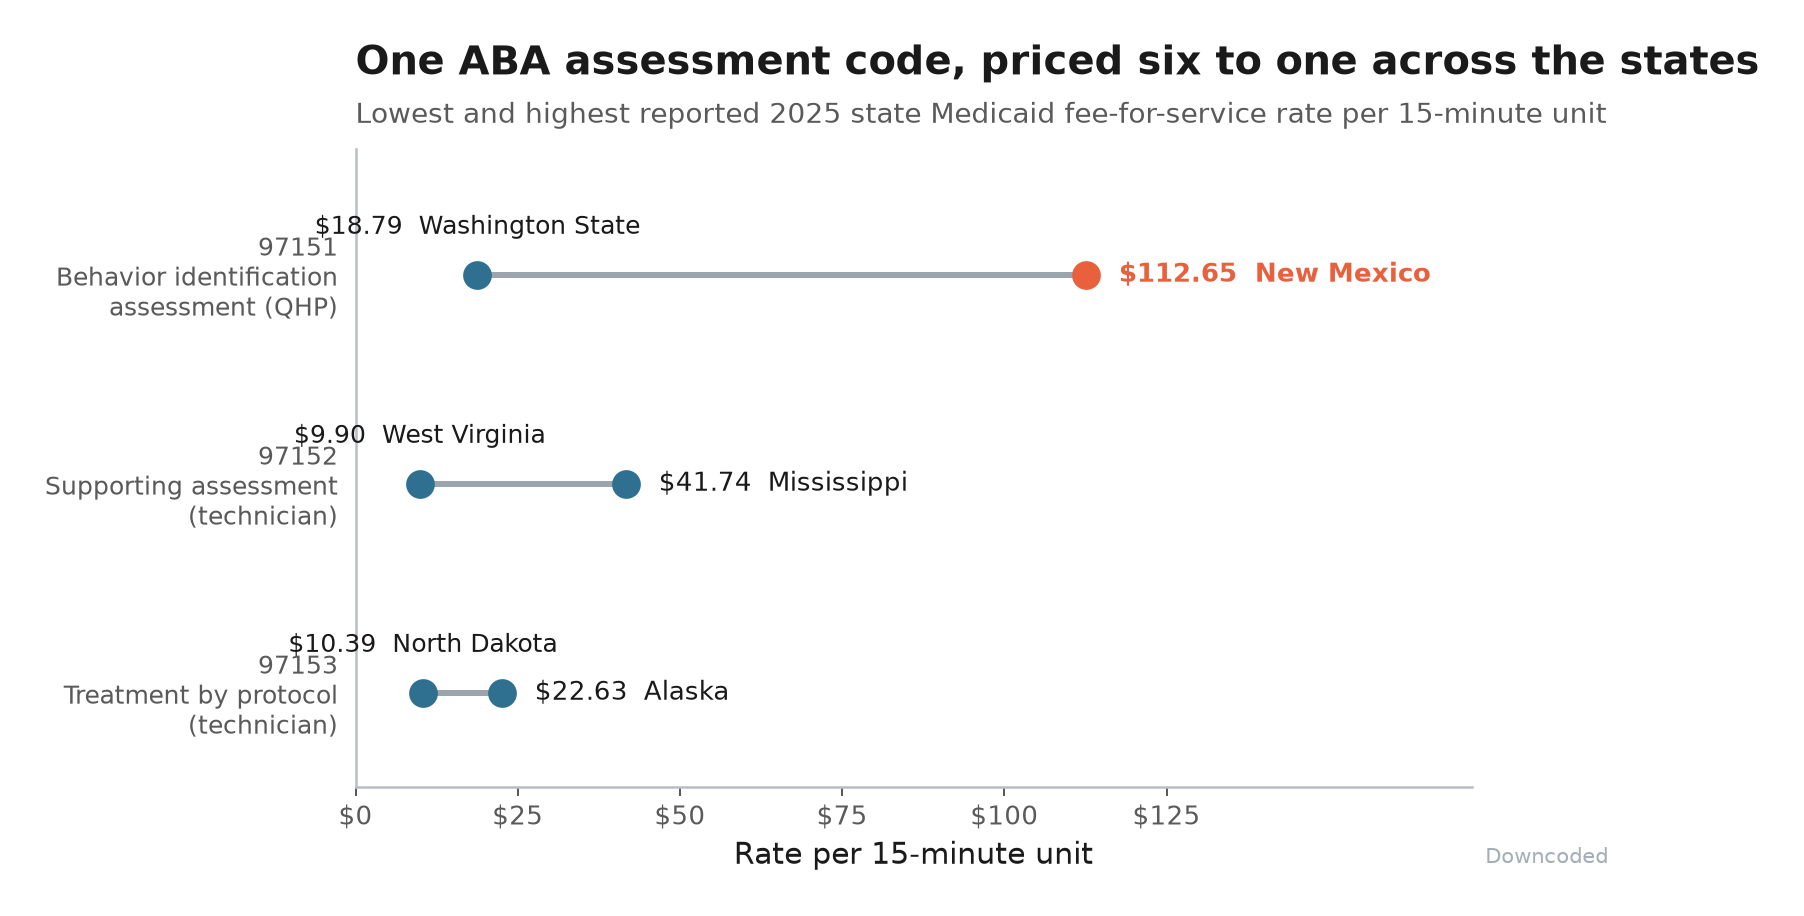
The new state toolkit for applied behavior analysis runs 173 pages, and the last appendix is the part to keep: reported 2025 Medicaid fee-for-service rates by state and CPT code, verified against paid claims. The assessment code spans six to one.
If you bill applied behavior analysis in more than one state, you have assembled the cross-state rate sheet yourself, one Medicaid provider manual at a time, and you have re-assembled it every time a state quietly reposted its fee schedule.
CMS published that sheet on Tuesday.
The State Medicaid and CHIP Applied Behavior Analysis Toolkit landed August 4, runs 173 pages, and sets no new federal requirement. It is a reference document for state agencies.
The useful thing about it, from a billing seat, is that assembling a reference document for fifty-one programs required CMS to write down what all fifty-one of them actually pay.
What Is Actually in the 173 Pages
The methodology note is the tell. CMS built this on a targeted review of 264 literature sources, plus more than 240 publicly available state-level Medicaid coverage and policy references spanning all 50 states and the District of Columbia, then ran state roundtables and stakeholder interviews on top.
Five chapters, and they run in the order a program gets built:
- ABA overview, including the cost and utilization trends
- Clinical standards: diagnosis, treatment plan, frequency and intensity, re-evaluation, staffing, caregiver involvement
- The federal authorities a state can cover ABA under, and care coordination
- Payment approaches: fee schedule, bundled, per diem, value-based, and managed care
- Provider qualifications, credentialing and enrollment, supervision, telehealth, and ownership
CMS also says plainly what it did not settle. Mental health parity, quality measure development, facility licensure, and value-based models all get named as areas that need more work.
A federal document conceding its own open questions on the eighth page is worth a little trust.
The Appendix Worth Keeping
Appendix E carries Table E1: reported 2025 state fee-for-service rates for the ABA CPT codes, by state, across eleven code-and-credential columns. Not just 97151 through 97158, but the credential splits inside them, so 97153 appears once for a mid-level provider and once for a technician, and 97155 and 97156 each appear at both the QHP and mid-level tier.
Where the numbers come from matters more than the table itself. The rates start from CASP's fifty-state Medicaid benefit comparison, and then CMS verified them using actual fee-for-service claims-paid amounts from TAF. Blanks mean a rate was not in the CASP report or could not be verified. A vendor survey nobody checked is one thing. A vendor survey reconciled against paid claims by the agency that holds the claims is something you can put in a rate appeal.
Then there is the spread (chart below). Take the lowest and highest reported 2025 rate for the same code, per 15-minute unit:
- 97151, behavior identification assessment by a qualified health care professional: $18.79 in Washington State, $112.65 in New Mexico. Six to one.
- 97152, supporting assessment by a technician: $9.90 in West Virginia, $41.74 in Mississippi.
- 97153, treatment by protocol, the most frequently billed code in the family: $10.39 in North Dakota, $22.63 in Alaska.
Why the Spread Is That Wide
Some of it is real cost-of-living and rate-setting philosophy, which CMS says up front. The rest is definitional, and that is the part that bites anyone comparing rates across a border.
States differentiate these codes by site of service, to carry the travel time and cost of an in-home session. They differentiate again by the credential of the billing provider, so a BCBA, a BCaBA, and an RBT can each draw a different rate off the same code. Two states can print wildly different numbers next to 97153 and be paying comparable money for comparable work, or not, and the fee schedule alone will not tell you which.
Managed care is the honest gap. Plan-to-provider terms are negotiated and generally not public, so the appendix is a fee-for-service picture. CMS says so.
The Curve That Prompted It
The document exists because of one chart CMS ran off T-MSIS claims and encounters for 2021 through 2025.
Beneficiaries with an ASD diagnosis who received any Medicaid or CHIP service went from 1.15 million to 1.92 million, up 67 percent. Total Medicaid and CHIP payments for ABA over the same four years went from roughly $1.94 billion to $10.1 billion, up 421 percent.
One more number from that analysis, which we have not seen quoted anywhere else: in 2025, $1.47 billion, or 14.5 percent of all Medicaid and CHIP ABA spending, paid for ABA delivered to treat conditions other than autism. The toolkit puts ADHD in that bucket and sends the detail to Appendix C. If you code ABA against a non-F84 diagnosis, that is now a documented, federally measured share of the benefit rather than an edge case.
CMS names three partial causes of the curve: state mandates on fully insured plans, the creation of ABA-specific CPT codes, and its own 2014 guidance naming ABA as an option states could cover.
Final Thoughts
The rate table will go stale. State fee schedules move, the CASP comparison it draws on updates annually, and there is no commitment anywhere in the document to refresh Appendix E.
What is durable is the precedent. CMS took a benefit that fifty-one programs price independently, pulled the published rates together, checked them against its own paid claims, and put the result in a free PDF.
That is the work a policy vendor charges for, and the agency did it because it needed the answer for its own purposes.
We will take that trade every time.
Thanks for reading.