 Downcoded
Medicare's Opioid Clinic List Gained 114 Names the Hard Way
CMS republishes the roster of Medicare-enrolled opioid treatment programs every week. Across 41 monthly snapshots since May 2023 it added 529 NPIs and dropped 415 to finish 114 ahead, and the stretch from August 2025 to January 2026 was five straight months of decline. Here is the whole series, plus the $229 million of CY2024 billing sitting on top of it.
Once a week, CMS reposts a list of every opioid treatment program enrolled in Medicare. Nine columns, a new filename, no announcement.
We pulled 41 of those files, the last one of every month back to May 2023, and counted the distinct NPIs on each.
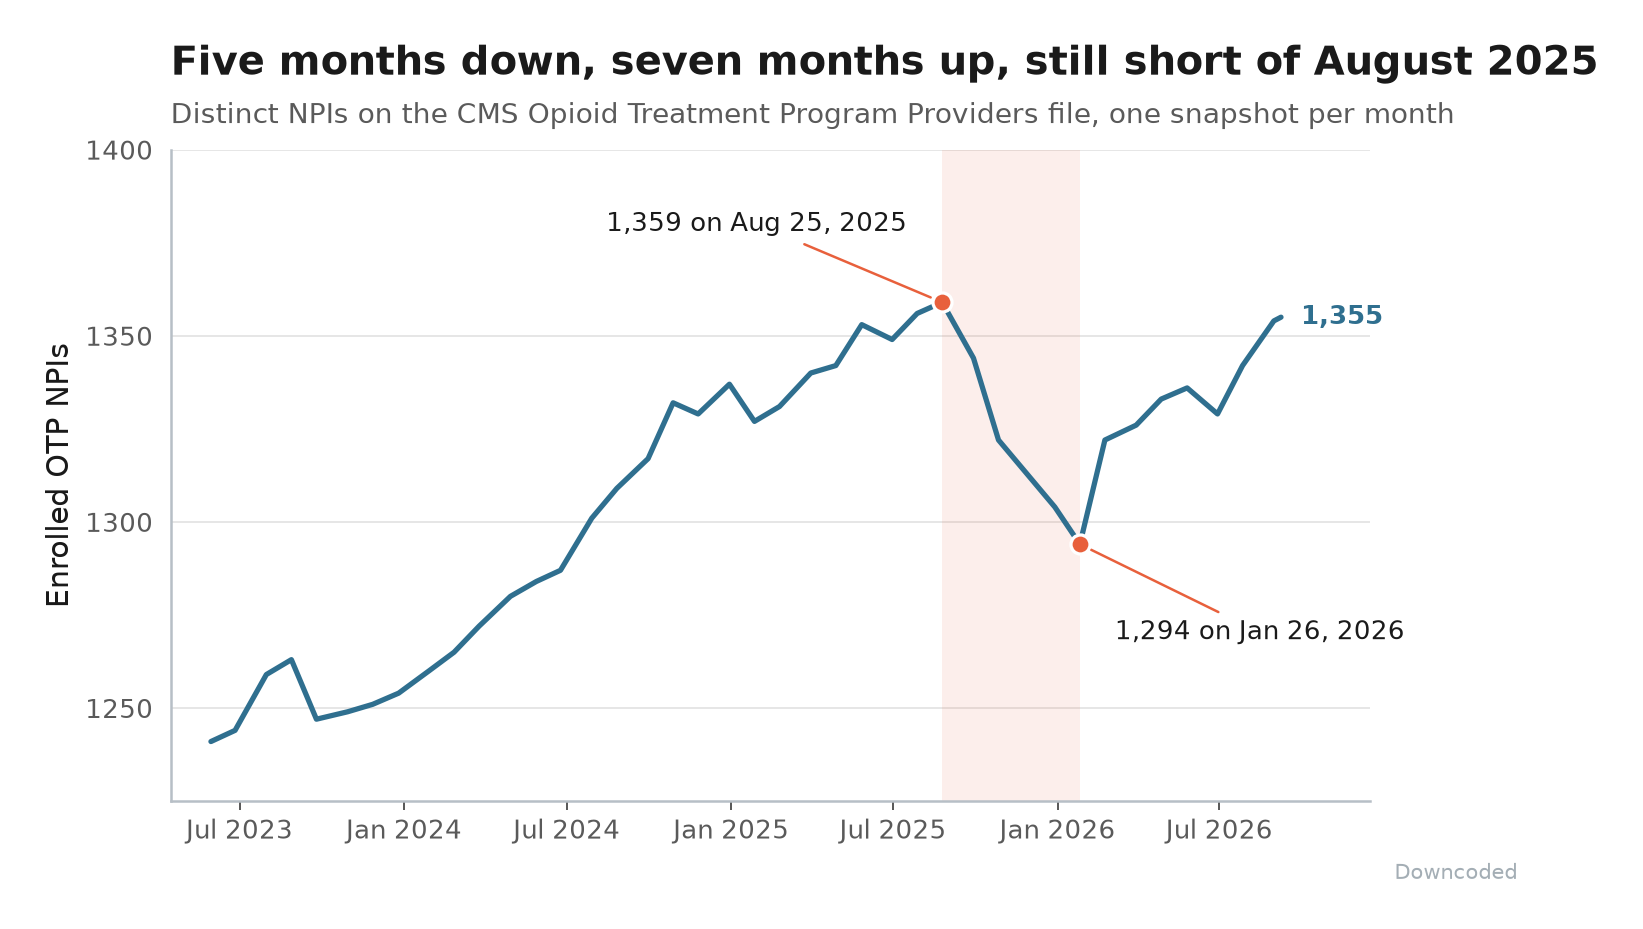
The roster climbed for two years, shed 65 programs across five straight months starting in August 2025, and has spent the seven months since clawing back to four short of its own peak (chart below).
The Five Months
The peak is 1,359 distinct NPIs on the August 25, 2025 file. The trough is 1,294 on January 26, 2026.
That is -4.8% in five consecutive negative months. Nowhere else in the series is there a losing run longer than one month.
The gross numbers run harder than the net. Over those five months the file lost 153 NPIs and picked up 88, so the visible 65-program dip was assembled out of 241 separate arrivals and departures.
"How many of the clinics on last August's list are still on the list?"
A hundred and eight of them are not. Those 108 NPIs sat on the August 25 file and are absent from the January 26 file, and they cluster: 20 in California, 16 in Ohio, 11 in Illinois, 9 in Maryland.
No transmittal, MLN Matters article or press release we can find this week explains the drop. We are giving you the arithmetic and the geography, and leaving the cause alone.
Then February Happened
The February 23, 2026 file added 36 NPIs against 8 removals, a net +28 and the largest single-month gain anywhere in the series.
Seven monthly steps later the file sits at 1,355, up 61 from the trough. The August 2025 peak is still four names away.
529 In, 415 Out, 114 Up
Zoom out to the full 40 month-to-month transitions and the churn stops looking like an episode.
- 529 NPI additions
- 415 NPI removals
- Net movement: +114, from 1,241 on the first file to 1,355 on the last
So the list moved 944 times to end up 114 higher, and it is worse than that, because sampling one file a month out of a weekly series misses every program that arrives and leaves inside the same month. Treat 944 as the floor.
Continuity is thinner than the headline count suggests too.
Of the 1,241 NPIs on the May 2023 file, 171 are gone. Of the 1,355 on the current file, 285 were not there three years ago.
1,070 appear on both ends.
Rows Are Not Programs
One trap before you load this into anything.
The current file has 1,572 rows and 1,355 NPIs. Seventy-five NPIs carry more than one row, because the file is keyed to enrollment locations and a multi-site operator files one NPI across all of them.
The extreme case is BrightView LLC, NPI 1659769446, which occupies 49 rows: 35 in Ohio and 14 in Kentucky, from Sandusky to Chillicothe to Covington.
Count rows and you overstate the program count by 217. Key on NPI and you collapse 49 clinics into one.
What Sits on Top of It
The OTP benefit is small next to the rest of Part B, and it still moves real money. In CY2024 the ten OTP bundle codes with published national rows carry $229.2 million in Medicare allowed dollars, on our arithmetic from CMS's own geography-and-service file.
Almost all of it is one code. G2067, the weekly methadone bundle, ran 868,503 services at an average allowed $224.78, which is $195.2 million across 1,199 rendering providers, or $162,824 apiece.
That file suppresses anything under 11 beneficiaries, so those are floors.
Put the two together and each name on the roster is worth roughly the salary line of the counselor delivering the bundle.
Final Thoughts
Nobody publishes a press release when a methadone clinic stops billing Medicare. The event shows up as a row that is in one week's CSV and gone from the next, in a file that refreshes on a schedule nobody watches.
If you send referrals into this network, verify payer participation for it, or model panel capacity off it, the count you cached last August is wrong in both directions now: 108 programs left and 43 arrived in the same five months that moved the headline by 65.
The roster has recovered. The names on it have not.
Thanks for reading.