 Downcoded
Nobody Published Fiscal 2024's Fraud Enforcement Numbers
OIG's Health Care Fraud and Abuse Control report has one entry per fiscal year, unbroken, from 2005 to 2023. Then it skips to 2025, and the 2025 edition that posted Wednesday is a single page. The eight numbers that fit on it include 2,837 new exclusions, the most since 2017, and 861 civil actions, the most in a decade.
OIG's list of Health Care Fraud and Abuse Control reports carries one entry per fiscal year, unbroken, from 2005 through 2023.
Then it skips to 2025.
The FY2025 edition went up Wednesday, and the jump is the first thing you
notice about it. The second is the file size. 66 kilobytes, one page,
headed "KEY FACTS AND FIGURES," ending in the footer www.hhs.gov. The FY2023
edition ran past 120 pages and closed with an appendix showing the arithmetic
behind the return-on-investment figure and a table of every dollar that went
into the HCFAC account and every dollar that came out.
"What does a year of federal health care fraud enforcement look like when the annual report is a single page?"
What Fits on One Page
Eight boxes, and they are not nothing. DOJ opened 741+ new criminal health care fraud investigations in FY2025 and filed charges in 382+ cases against at least 601 defendants. More than 448 defendants were convicted during the year. Civil False Claims Act settlements and judgments in health care topped $6.9 billion, against $1.8 billion in FY2023. The FBI disrupted 356 criminal fraud organizations and dismantled 79 enterprises. HHS-OIG's own investigations produced 622 criminal actions, 861 civil actions, and 2,837 exclusions. The program returned $3.20 for every dollar spent across FY2023 through FY2025.
Now, what is not on the page. There is no Medicare Trust Fund transfer figure.
FY2023's report put that at almost $974 million into the Trust Funds plus $257.2 million of federal Medicaid money routed separately to CMS, out of more than $3.4 billion returned in total.
The FY2025 sheet has no equivalent line, no appropriation figure, and no appendix.
Which is the part the statute actually asks for.
42 U.S.C. 1395i(k)(5) tells the Secretary and the Attorney General to submit jointly, not later than January 1, a report to Congress identifying the amounts appropriated to the account and the amounts appropriated from it, with the justification. The ROI box is a ratio with both of its inputs withheld.
The Number Your Monthly Screen Feels
2,837 is the one to take away. That is more individuals and entities put on the exclusion list in a single fiscal year than in any year since FY2017, and 34.3% above FY2023's 2,112 (chart below).
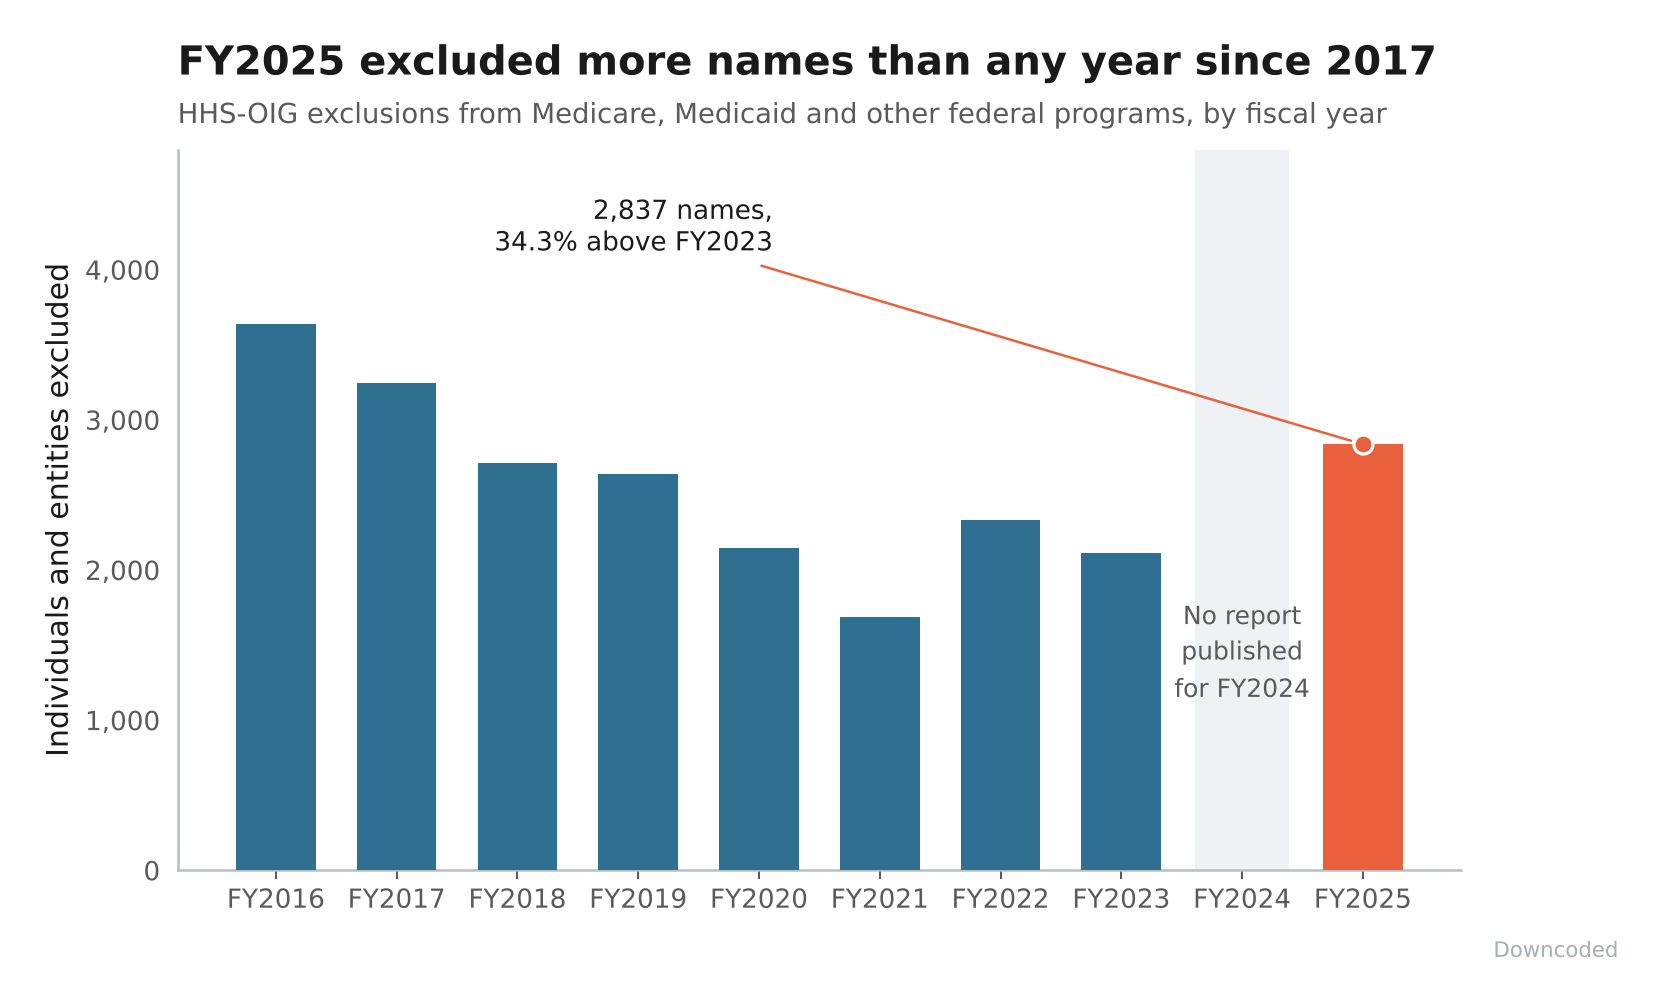
Run it per month and it stops being a trivia number: roughly 236 new names a month hitting the LEIE in FY2025, against 176 a month two years earlier.
You are not required to look. OIG has said so plainly since the 2013 Special Advisory Bulletin, which notes there is no statutory or regulatory requirement for a provider to check the LEIE, then adds that OIG updates the list monthly, so screening employees and contractors each month is what best limits overpayment and CMP liability. The exposure sits in 42 CFR 1003.200(a)(3): a claim for an item or service furnished during a period in which the person was excluded is its own basis for a penalty, an assessment, and an exclusion of your own. The bulletin prices it at up to $10,000 per item or service, on top of refunding what was paid.
A 34% bigger inbound stream against a screen you run voluntarily is a quiet way to accumulate a problem.
Criminal Flat, Civil at a Decade High
The mix underneath the headline moved too.
- 622 criminal actions is below every year from FY2016 through FY2019, which ran 765, 788, 679 and 747.
- 861 civil actions is the highest in the ten fiscal years these reports cover. False claims, unjust-enrichment suits, CMP settlements.
- FBI operational disruptions fell from 620 in FY2023 to 356, and enterprises dismantled from 127 to 79.
So the instruments that require a prosecutor and a jury are flat to down, and the two that land on a billing office without either, civil action and exclusion, both ran higher than they have in years. That is the shape of a year where enforcement reaches more providers through paper.
Final Thoughts
The $3.20 ROI is up from $2.80, and OIG frames it as a three-year rolling average for good reason, since any single year swings on which cases happen to settle.
The window that would show you where the recovery came from is FY2022 through FY2024, and nobody published it. You get the ratio and none of the years inside it.
Frankly, a revenue-cycle department does not budget off an enforcement report. What it does do is set the cadence of its exclusion screening, and the one number that survived the page cut says that cadence got more expensive to skip.
Thanks for reading.