 Downcoded
Pennsylvania Published Ten Carriers' Prior Auth Denials
The federal transparency file has 6,764 plan rows and not one of them is from Pennsylvania. The state's insurance department fills the hole itself, and its fourth edition, posted yesterday, is the first to carry the new pre-service table: 1,569 prior auth appeals, 379 overturned, and an external reviewer that sided with the member about half the time.
If you work denials on individual-market plans in Pennsylvania, the federal file that is supposed to carry carrier-level denial numbers has nothing for you.
We pulled the current Transparency in Coverage PUF off CMS this morning and counted. 6,764 plan rows on the individual QHP sheet, 30 states, 185 state-issuer pairs, and zero rows from Pennsylvania.
So the state does it itself. The Pennsylvania Insurance Department posted the fourth edition of its own Transparency in Coverage Report yesterday, and this one carries a table the federal file has no column for.
Prior authorization.
What the New Table Says
The federal template changed for the 2026 submission. On-exchange individual QHPs now report pre-service determinations and pre-service appeals, plus a behavioral-health split on the claims side, and not only the paid-and-denied counts they have filed since 2021.
Pennsylvania's Office of Product Regulation compiled the first year of it and printed it by carrier, ten of them, for calendar year 2025.
Here is the part worth your afternoon.
Members filed 1,569 internal appeals of pre-service denials and 379 came back overturned. Another 113 went to external review, and 56 of those were overturned, which works out to 49.56% (chart below).
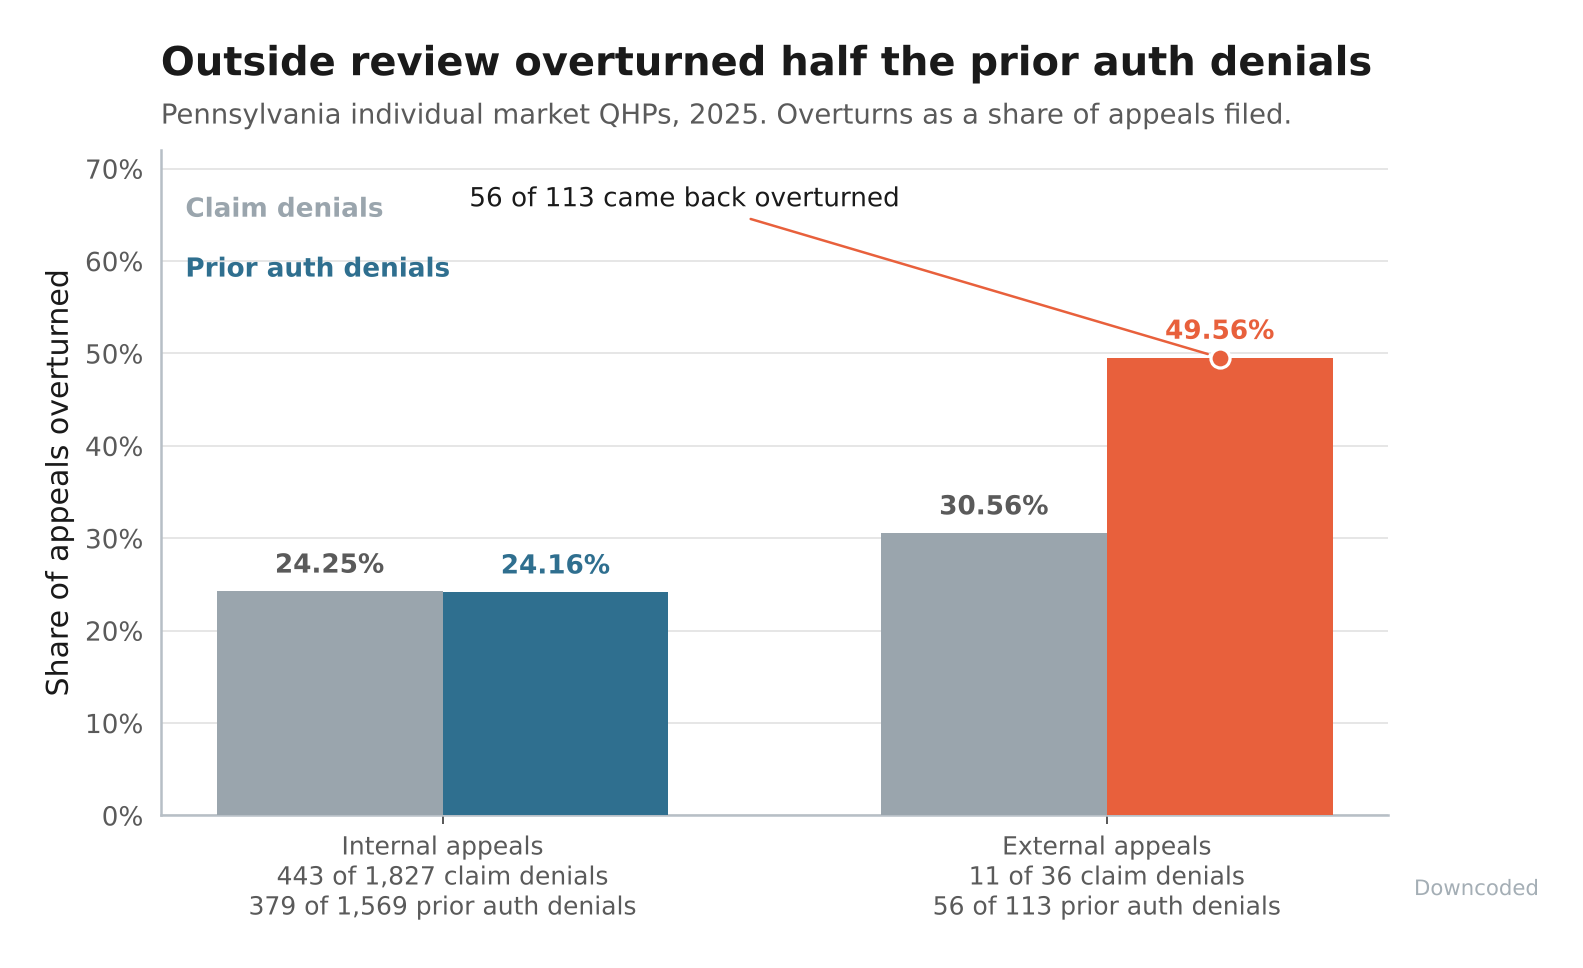
Every rate in that chart is our arithmetic on the report's own counts rather than its published rate column, which computes the 2025 Pennsylvania figure against claims received and the 2024 one against claims denied. The counts themselves appear identically in three places in the document.
Set it against the claims side of the same report. 2,715,478 claims denied in 2025, 1,827 internal appeals filed, 36 external appeals filed.
That is a member appeal rate of 0.067%, and an external review docket of three dozen cases for a market that received 15.65 million claims.
An external reviewer looking at a prior auth denial in Pennsylvania flipped it half the time. Almost nobody asked one to look.
Why Your State Probably Isn't in the Federal File
The PUF is not hiding Pennsylvania. Its own disclaimer scopes it to plans sold on the federally facilitated exchanges, including the states that run plan management on the federal platform, and the state-based exchanges on the federal platform.
Pennsylvania runs Pennie, so its carriers were never going to land in there.
Count what that leaves out and it is not a rounding error. Thirty states appear in the 2026 file.
Twenty-one of the fifty-one state-level jurisdictions appear nowhere in it, and the list of absent ones reads like a map of the state-based exchanges: California, Colorado, Connecticut, Massachusetts, Maryland, Minnesota, New Jersey, New York, Washington, Pennsylvania.
"Who publishes your carriers' denial numbers, and would you know if nobody did?"
Check whether your own insurance department runs this. Pennsylvania has shipped four editions since 2023, each one off a data call the department makes on its own authority on top of the federal template, and it goes up as a plain PDF with no login and no vendor in front of it.
The Appendix Is the Part to Bookmark
Pages 14 through 16 are not data at all. The department asked every insurer in the state for a live URL against each public disclosure the ACA requires, then printed the answers in a table.
Four categories, nine carriers, Highmark and IBC and UPMC and UnitedHealthcare among them:
- claims payment policies and practices
- out-of-pocket cost information and the underlying negotiated rates
- negotiated rates with in-network providers
- historical payments to and billed charges from out-of-network providers
That is a maintained index of where each carrier actually keeps its claims-payment policy and its machine-readable rate files, refreshed once a year by somebody whose job is to ask. Try assembling that yourself across nine payers and you will spend a week.
The denial-reason breakout earns a look too. Ten buckets, 3,639,678 reasons reported at plan level, and the one CMS defines as everything the other nine do not capture leads at 1,355,022 (chart below).
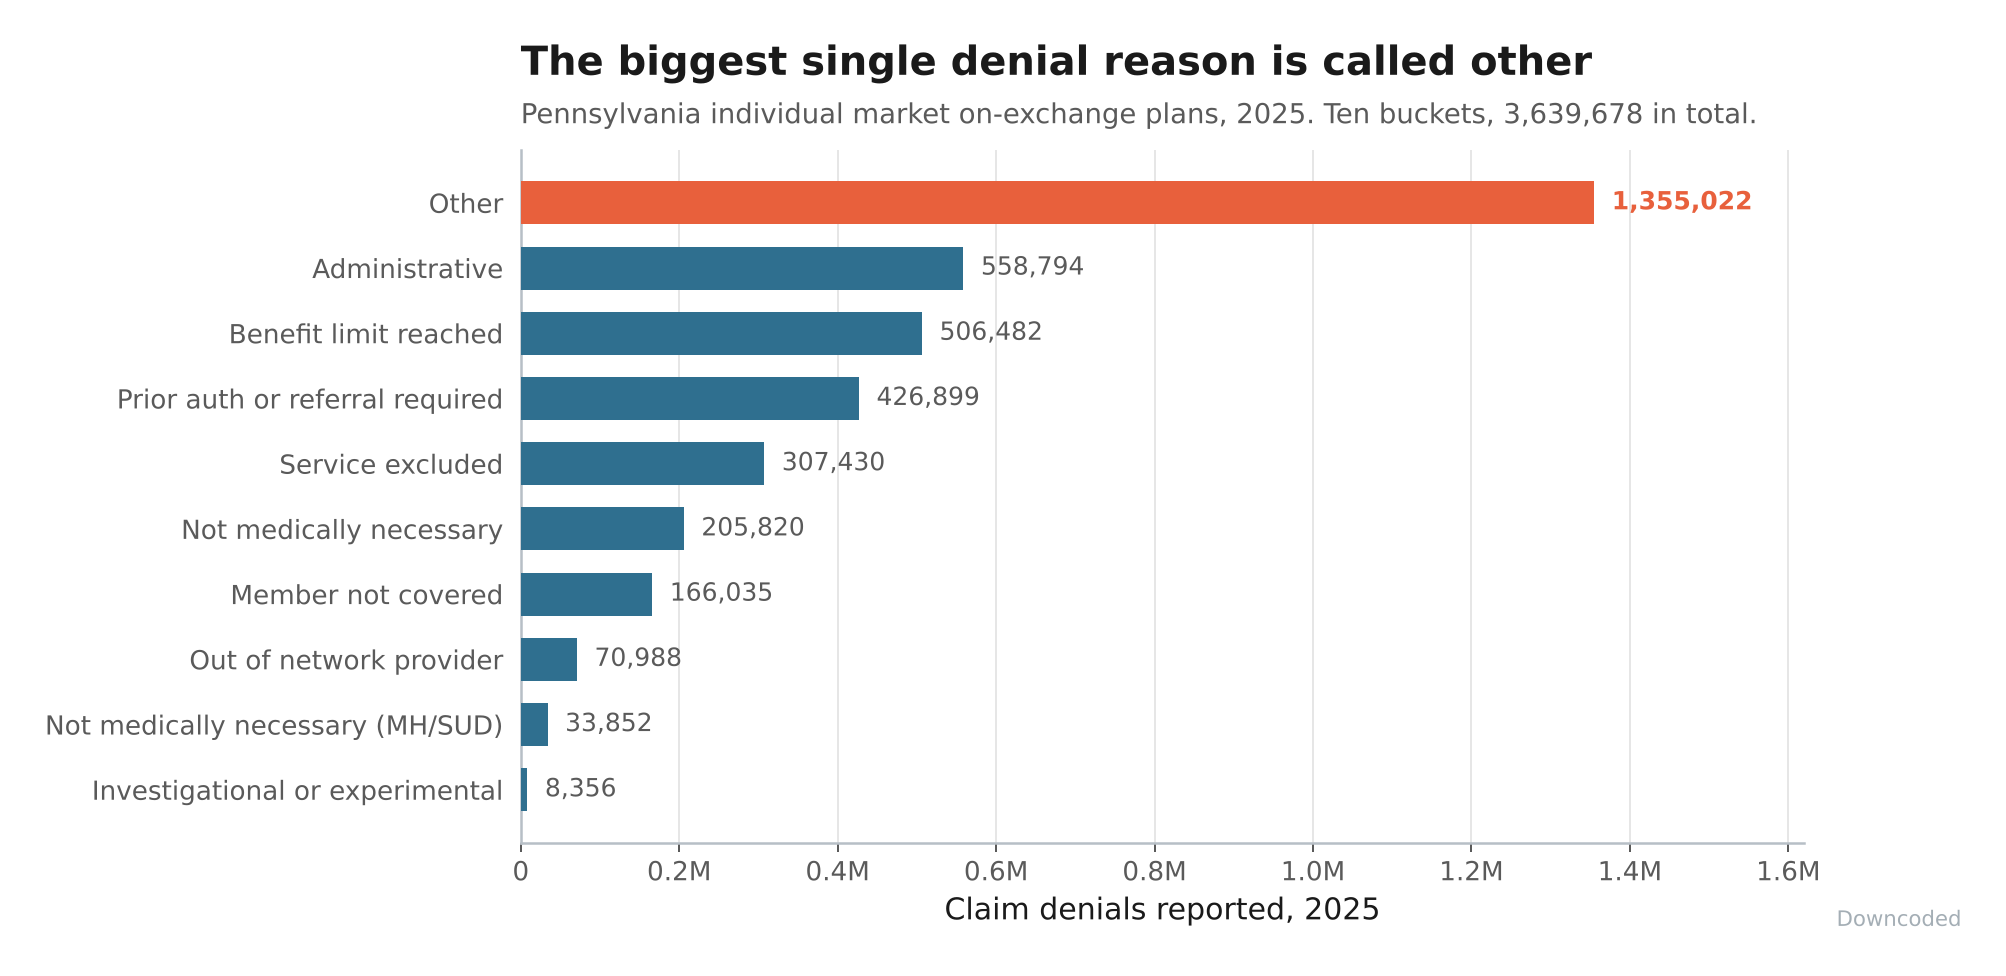
Administrative is second at 558,794. Prior authorization or referral, the bucket most billing offices would guess runs first, is fourth at 426,899.
Final Thoughts
None of this is a dataset anyone built for revenue cycle. It was built for a consumer picking a plan, which is why it ships just ahead of open enrollment and why the press coverage led with the denial rate.
The useful part is underneath. A state agency with no particular incentive to do so spent four years turning a federal compliance template into a public, carrier-named, downloadable record, added the prior auth tables the month they first existed, and stapled on an index of every payer disclosure URL in the market. Twenty states and a district have carriers that show up nowhere in the federal file, and every one of them collects the same template Pennsylvania does.
Pennsylvania's revenue-cycle departments got a number they can put in front of a payer this week. The rest of us got a worked example, and a URL to send our own commissioner.
Thanks for reading.