 Downcoded
The 12,431,122 Enrollees CMS Took Out of One Footnote
CMS replaced the CY2020 and CY2021 Medicare Advantage inpatient workbooks on Thursday afternoon. Five cells moved in each, four of them a link, and the fifth is the enrollee count every per-1,000 rate in the table divides by. For two data years it was the fee-for-service count instead.
If you have ever built a Medicare Advantage inpatient benchmark on top of CMS Program Statistics, the enrollee count you cited was counting the wrong population.
CMS replaced the CY2020 and CY2021 Medicare Advantage inpatient workbooks on
Thursday afternoon. The zip members are stamped 17:33 and 17:34 on
September 24, and both filenames now end in FINAL_UPDATED.
Five cells moved in each workbook. Four of them are a link.
The Fifth Cell
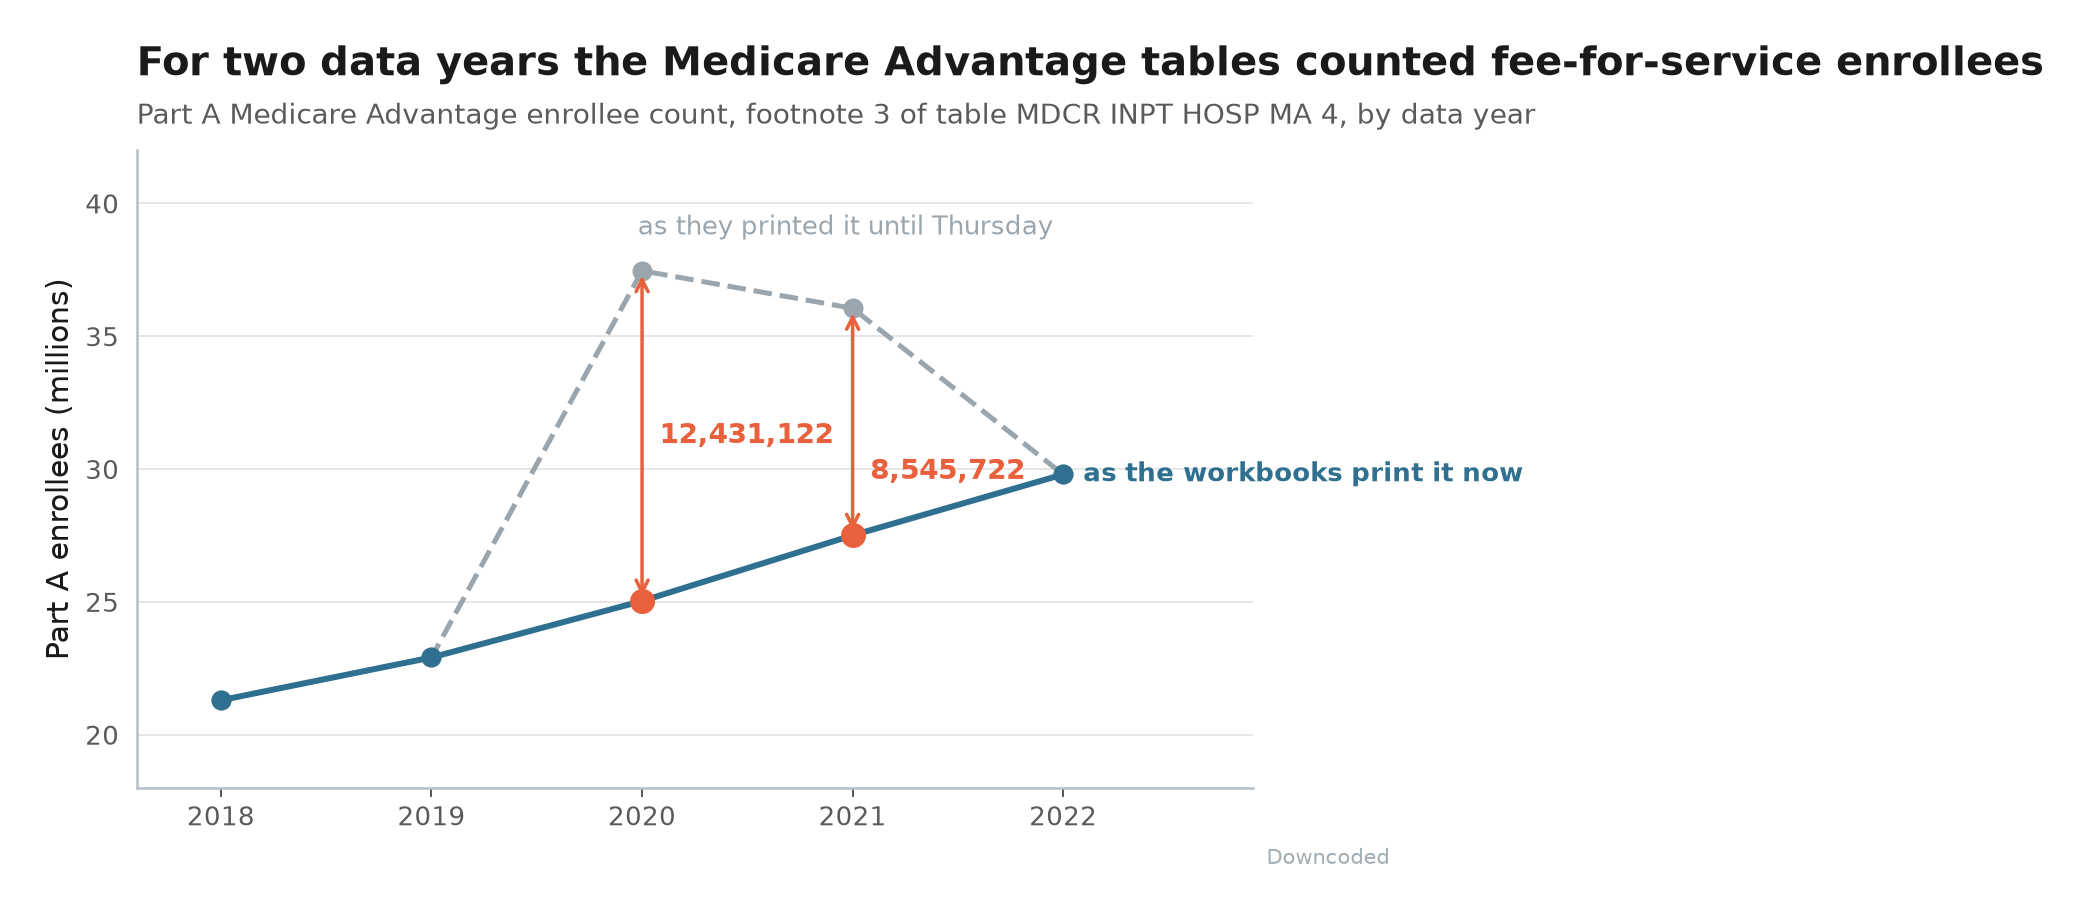
Footnote 3 of table MDCR INPT HOSP MA 4 is the sentence that tells you what population the whole table is normalized against. In the CY2021 workbook it used to read that the Part A Medicare Advantage enrollee count for 2021 was 36,051,507.
It now reads 27,505,785.
The CY2020 workbook went from 37,464,937 to 25,033,815, a move of 12,431,122 people, and the corrected pair puts Medicare Advantage back on a growth curve that only ever went one way (chart below).
Set the two versions of each workbook side by side and the scale of the edit is easy to state. CY2021 has 1,407 populated cells in both versions and five differ; CY2020 has 1,373 and five differ.
Four of those five, in each workbook, are the same methodology PDF repointed from
Inpatient Methods.pdf to the newer analytical methods 508.pdf on tables 4
through 7.
Not one utilization count moved. Not one rate moved.
Where 36,051,507 Came From
The number is real, and it belongs to a different set of tables.
Open the CY2021 Original Medicare Enrollment workbook from the same CMS Program Statistics family, go to table MDCR ENROLL AB 9, and read the Part A Total column:
- 2020: 37,464,937.
- 2021: 36,051,507.
Those are the two values the Medicare Advantage inpatient footnote carried for two data years. Same agency, same publication series, adjacent rows, opposite half of the program.
And the tell was sitting right there in the shape of it. That column runs 38,258,363 in 2019 down to 37,464,937 in 2020 down to 36,051,507 in 2021, because fee-for-service Part A enrollment was shrinking while people moved into plans.
So the footnote had Medicare Advantage shrinking through the years it grew fastest.
What It Does to a Number You Rebuild
Here is the part that matters for anyone whose deck cites these tables: the published rates were never wrong.
Take CY2021 total all hospitals. Divide 6,110,418 discharges by the published 222.1502844936445 discharges per 1,000 and multiply by a thousand, and you get 27,505,785. Do it with days of care instead and you get 27,505,785 again. Do it on the short-stay row, the critical access row, the long term care row, the psych row and the rehab row, and every one of them lands on the same number.
So the rates were computed against the corrected count all along. The footnote was the only thing out of step, and it is the thing an analyst copies.
Which gives you the size of the exposure, if you ever rebuilt a rate from the printed denominator rather than lifting it out of the column:
- CY2021: 27,505,785 ÷ 36,051,507 = 0.763. Your rebuilt rate lands 23.70% low. Discharges per 1,000 comes out 169.49 against the published 222.15; days of care per 1,000 comes out 1,096.16 against 1,436.73.
- CY2020: 25,033,815 ÷ 37,464,937 = 0.668. Your rebuilt rate lands 33.18% low. Discharges per 1,000 comes out 143.75 against 215.14.
The neighboring years reconcile cleanly, which is how you know a correction is all this was. CY2018 prints 21,298,339 and its rates imply 21,298,339.
CY2019 prints 22,908,331 and its rates imply 22,908,331.
Final Thoughts
Nothing about MA inpatient utilization changed on Thursday. A sentence under a table changed, in two files, with no notice attached and nothing in the dataset description to say what was corrected or why, and the only visible marker is the word UPDATED in a filename.
That is worth a minute of your time for the same reason a payer's quietly-reposted policy PDF is. These workbooks are the public floor under MA benchmarking, they are what shows up in board decks and contract negotiations as the neutral third-party number, and for two of the five published data years the denominator printed under them belonged to the other half of Medicare. If a number in your own model traces back to that footnote, it is off by a quarter to a third, and it has been since 2024.
Thanks for reading.