 Downcoded
Where Five Stars Hits the Ceiling
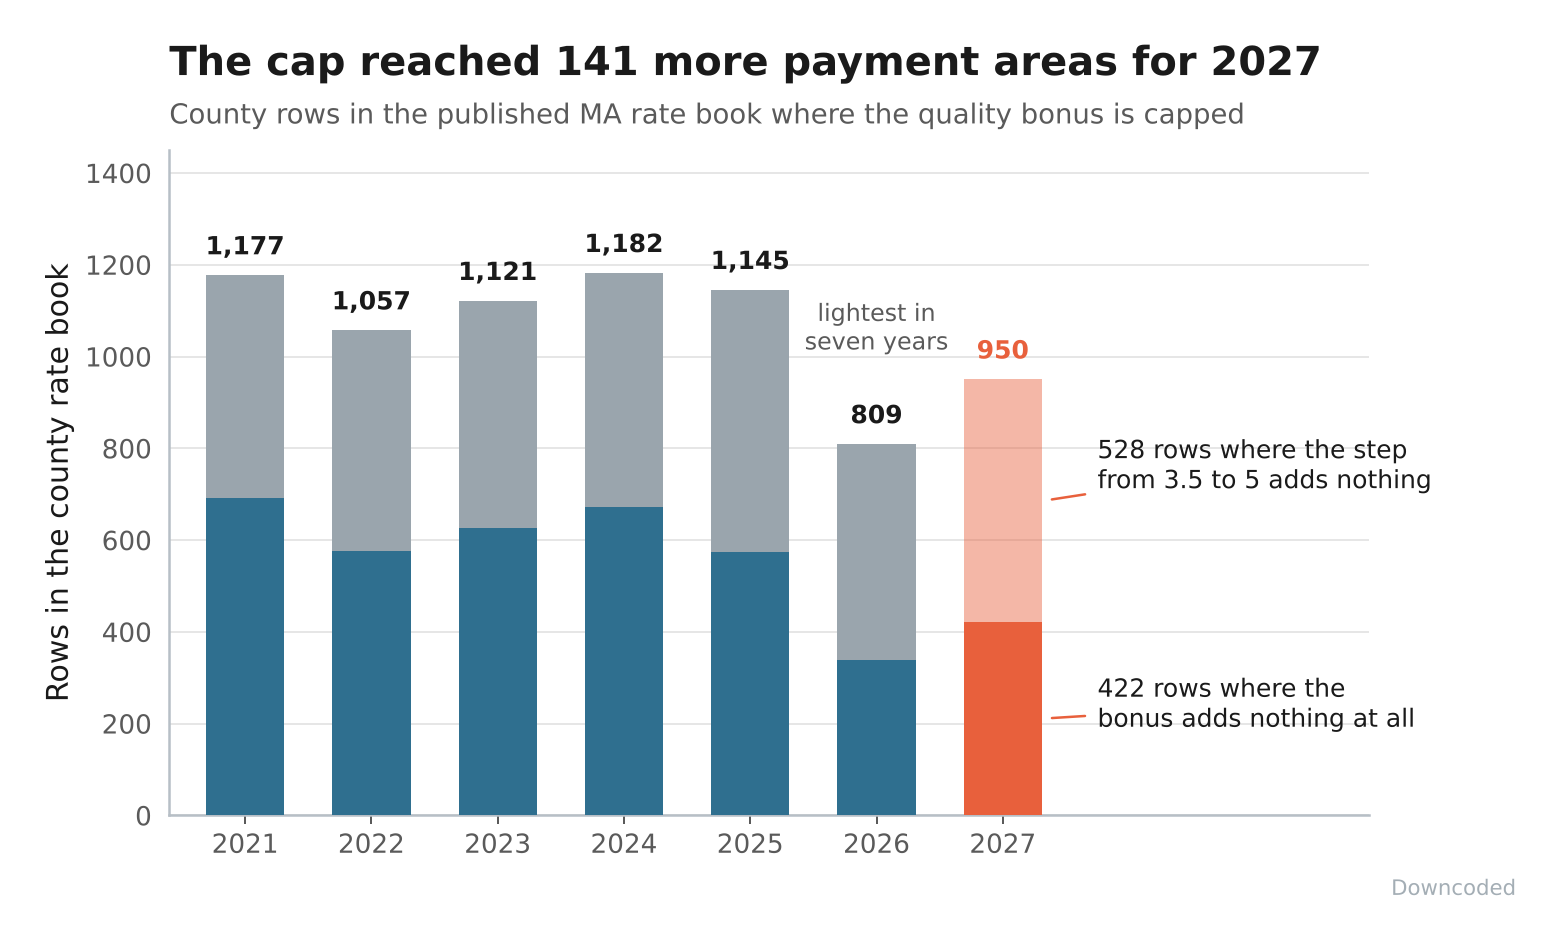
CMS put the 2027 Star Ratings on Plan Finder Thursday and open enrollment runs October 15 to December 7. We counted the places where a star rating cannot move the benchmark at all: in 950 of the 3,248 rows in the 2027 rate book the 5 percent and 3.5 percent bonus columns print the same number, and in 422 of those the 0 percent column matches too. A year earlier the count was 809.
The county rate book publishes every Medicare Advantage benchmark three times: once at a 5 percent quality bonus, once at 3.5 percent, once at zero. Three columns, side by side, same row.
Run one test on the 2027 book. Count the rows where the first two columns print the same number.
There are 950 of them, out of 3,248 (chart below). In those counties a contract that climbs from the 3.5 point bonus to the full 5 points moves its benchmark by $0.00.
CMS put the 2027 Star Ratings on Plan Finder Thursday and open enrollment runs October 15 to December 7, so the ratings are about to go into everyone's marketing. Those ratings set the 2028 quality bonus and the 2028 rate book does not exist yet.
The 2027 book is the best published read on where the bonus goes nowhere. In 29.2 percent of it, the top of the star scale is already worth zero in benchmark dollars.
One Column Against Another
The test is deliberately dumb, and that is the point. No assumed bonus percentage, no reconstruction of CMS arithmetic, no model.
Two published columns, compared to the penny.
The 950 split in two:
- 422 rows where all three columns match, so the quality bonus adds nothing at any tier. We reported that count yesterday evening as a limit on pricing the star moves; here it is as the subject.
- 528 rows where the bonus does reach the benchmark and the step from 3.5 to 5 does not. Alabama's Blount County pays $1,377.11 at both 5 percent and 3.5 percent, against $1,315.68 with no bonus at all.
Call the second group the quiet half. A contract there earns real money from four stars and earns nothing more from five, and nothing in the rate book flags the row.
Of the 422 full-stop counties, 397 sit in the 50 states and DC, spread across 40 of them, led by Indiana and Kentucky at 24 each and Georgia at 21.
The remaining 25 are territory rows, and 22 of those are Guam, which the file carries as 22 separate villages at one identical rate. The book counts rows, not counties, and we are not going to pretend otherwise.
Plans Asked CMS to Lift It. Again.
The mechanism is the pre-ACA benchmark cap, and the 2027 Rate Announcement says so in the plainest language CMS has used on it.
Commenters, per the Announcement, "urged CMS to use its administrative authority to lift the statutory cap on benchmarks," noting that benchmarks are capped at the pre-ACA formula amount, "which results in some plans not receiving the full quality bonus if the benchmark exceeds the cap."
CMS declined, in a sentence it has now recycled across several Rate Announcements: it has "not identified discretion under section 1853(n)(4) of the Act to eliminate application of the pre-ACA rate cap."
So the ceiling is statutory, the industry has asked repeatedly, and the answer has not changed.
One thing the cap does not touch: the rebate percentage. A plan's share of the savings between its bid and its benchmark still steps up with stars, and section 1853(k)(1) has nothing to say about it.
The benchmark is where the bonus dies.
The Set Moves 175 Counties a Year
The capped set is not a fixed list of poor rural counties you can memorize once.
Going into 2027, 175 counties entered the fully capped group and 91 left it. Only 247 were capped in both books, so two fifths of the 2027 group was not in the 2026 one.
The seven-year series makes the same point from further back. Rows with any cap on the bonus ran 1,177 in 2021 and 1,182 in 2024, then fell to 809 for 2026, the lightest year on the chart, before returning to 950 for 2027.
The 2027 book is still well under where it sat for most of the decade. The direction reversed and the level did not.
Where the bonus does land, it is worth having. Across the 2,826 rows that are not fully capped, the median gap between the 5 percent and 0 percent columns is $62.30 per member per month, or $747.60 a year.
Final Thoughts
The honest limit here is enrollment. CMS publishes no contract-by-county enrollment file in the current Contract and Enrollment Data set, so nobody outside the plans can say how many beneficiaries sit inside the 422, and we are not going to guess at it.
What the rate book will tell you is narrower and still useful. If you are modeling what a plan can afford in a market next year, the quality bonus is a variable in roughly seven counties in ten and a constant in the rest, two fifths of the 422 counties where it is worth nothing were not on that list a year ago, and the file that settles all of it has been public since April.
Thanks for reading.