 Downcoded
Where the Lab Work Goes After the Practice Sells
A nonprofit sitting on a billion commercial claims a year went and counted what happens to coding intensity and site of service in the two years around a physician acquisition. The lab share moved four times faster than the imaging share, and reading the whole thing costs nothing.
In the year before a health system bought them, those practices sent 55% of their patients' follow-up lab work to a non-facility setting.
A year after, 13% of it went there.
Same physicians, same established patients, same metabolic panels and A1cs, moving to a place that bills the same test under a different fee schedule.
Somebody sat down and counted that, and then gave the count away. The Health Care Cost Institute published the brief with West Health on August 18, the latest in a series on what changes about provider behavior after acquisition. This one takes the panel of physicians health systems acquired between 2019 and 2021 and follows their Medicare fee-for-service claims through the year before, the year of, and the year after.
Everything Moved Up One Step
Start with the evaluation and management mix, because that is the number your own coding audits chase.
In the year before acquisition, 54.6% of established-patient E&M claims from those physicians came in at Level 4 or Level 5. In the year after, 61.0% did.
What makes the chart worth a look is that no single code spiked. The whole distribution slid (chart below).
Level 3 gave up ground in each period, 39.3% to 37.0% to 35.3%, while Level 4 climbed 48.6% to 50.5% to 52.0% and Level 5 went 6.0% to 9.0%.
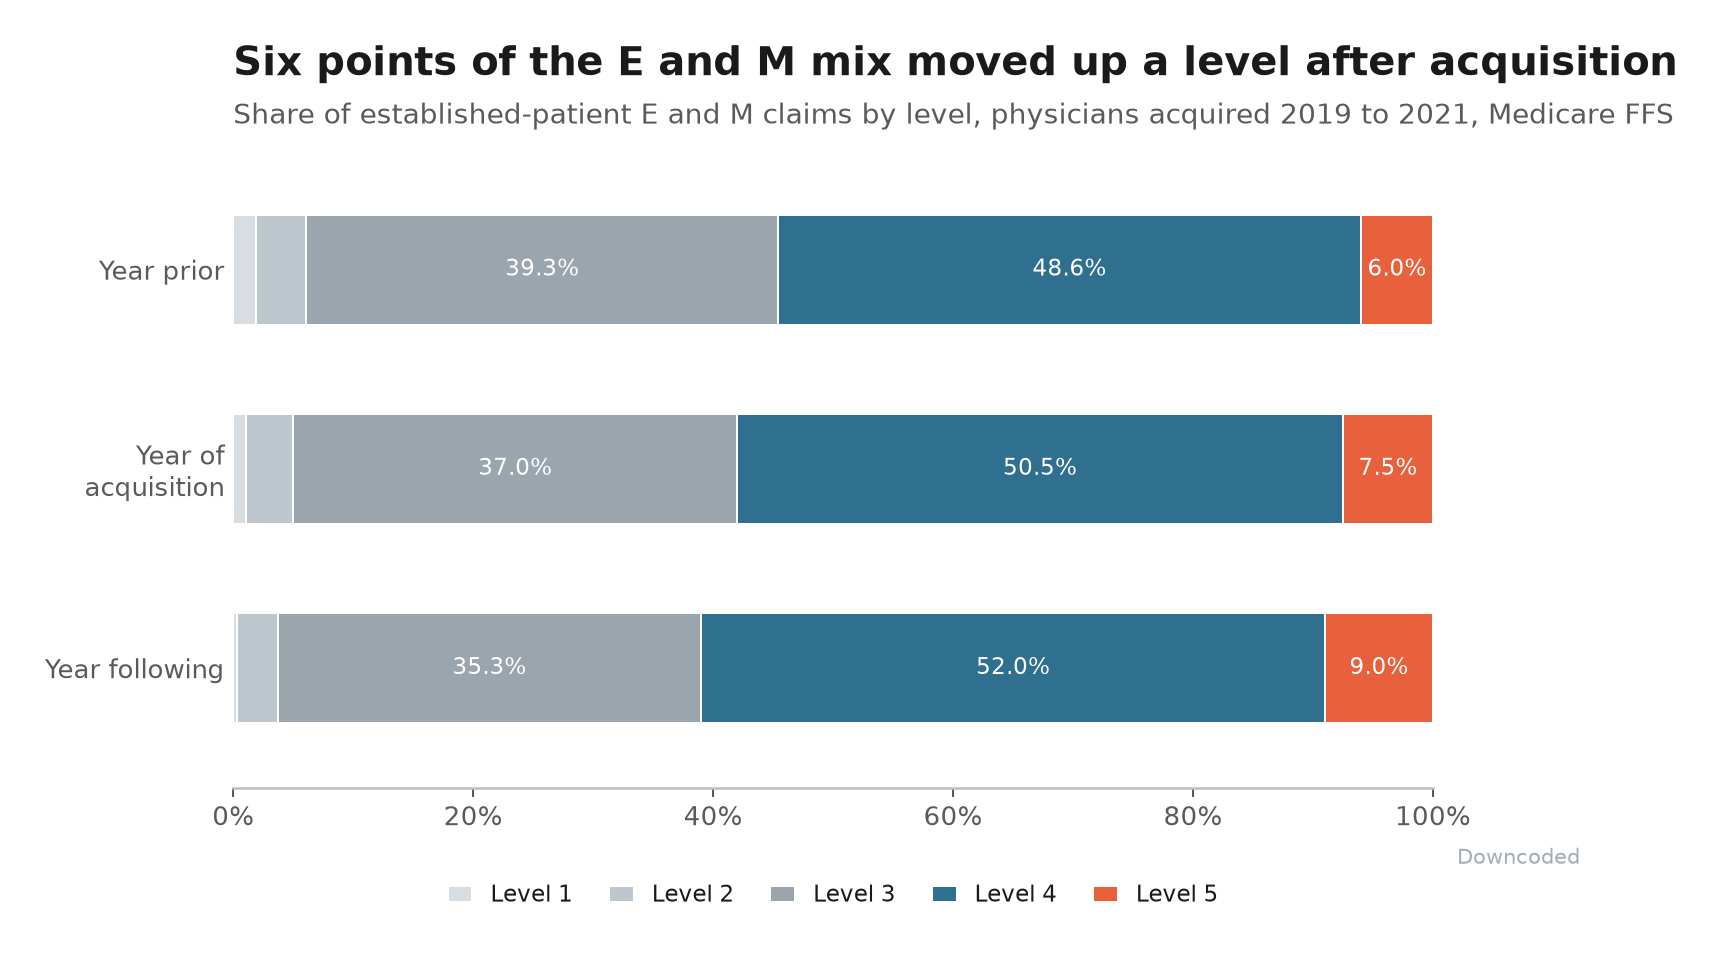
Level 1 nearly disappears, falling from 1.9% to 0.3%.
HCCI is careful about what it says this is. The language throughout is the language of association, and the brief never claims a single one of those visits was coded wrong.
A payment system that pays more for a Level 4 than a Level 3 will find its way into the mix. The finding is that it did.
The Lab Work Goes First
Now the part that surprised us.
The shift out of cheaper settings runs at two very different speeds.
Follow-up lab tests went from 55% non-facility to 32% to 13%, which the brief calls a more than four-fold decline. Follow-up imaging went from 67% to 60% to 54%, a drop of 13 percentage points over the same two years (chart below).
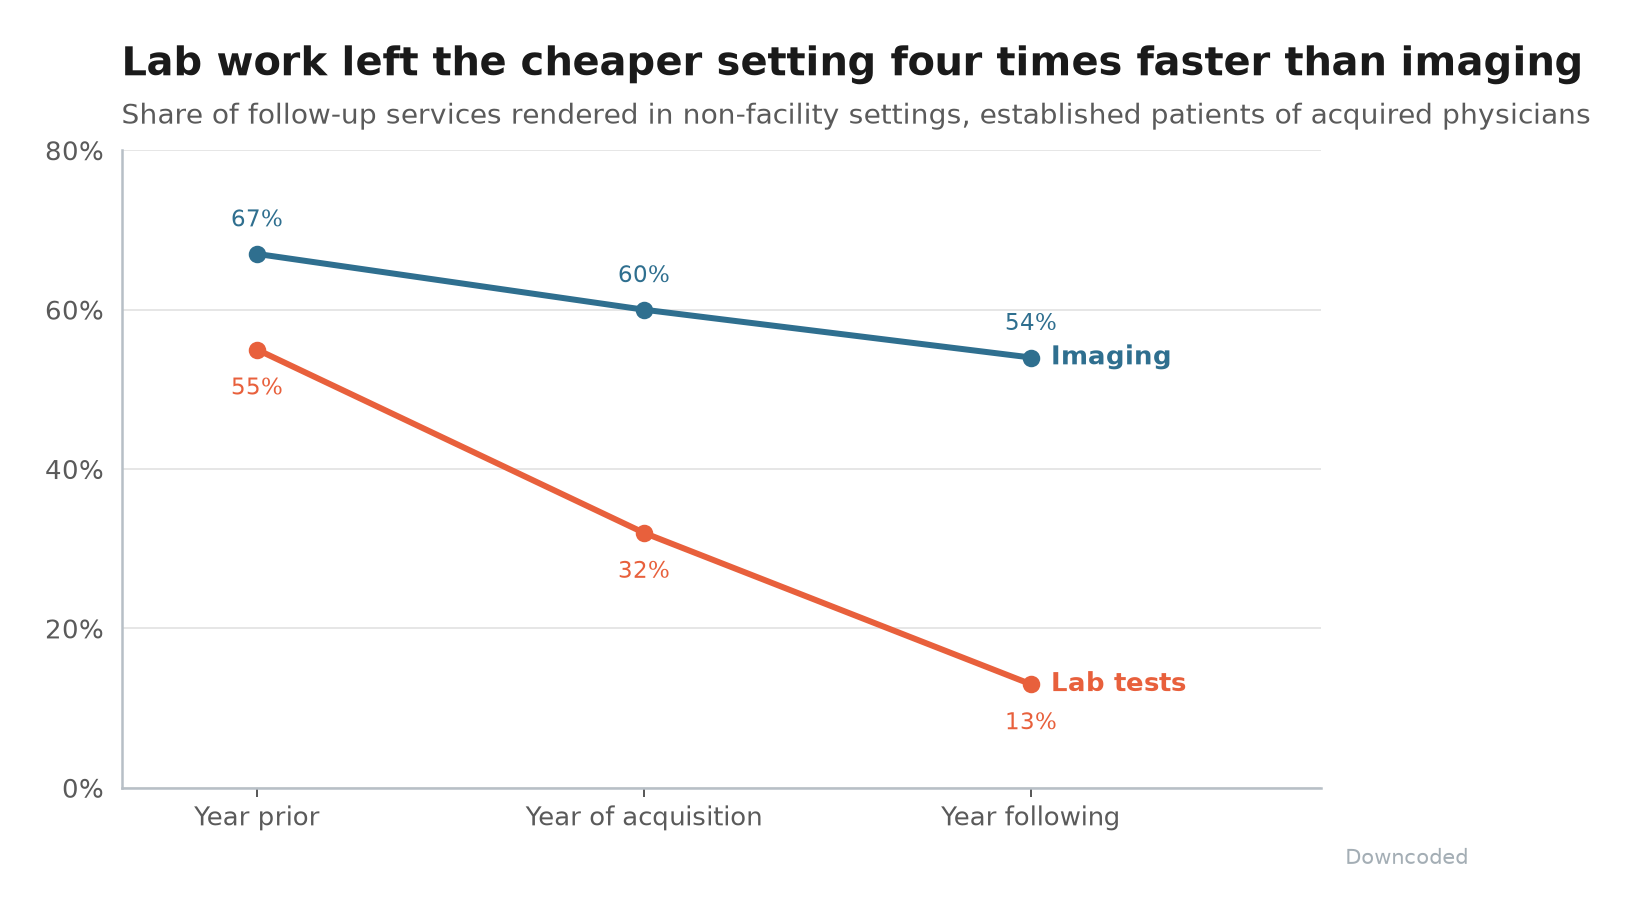
Two services under the identical incentive, and one of them moved four times as far.
The mechanism is not mysterious to anyone who has priced a comprehensive metabolic panel twice. Services rendered at a facility get paid under OPPS, services at a non-facility get paid under the physician fee schedule, and hospital-owned labs often collect substantially more for the identical test on the identical analyzer.
Lab work is also the easiest thing in ambulatory care to redirect. A send-out destination is a field in the order, and imaging is an appointment with a scanner, a schedule, and a patient who has opinions about parking.
Where it gets interesting for a payer-relations lead is the size of the residual. 54% of imaging was still going non-facility a year in, so whatever pressure is operating on the lab side is nowhere near finished on the imaging side.
Who Does This Counting
HCCI is an independent nonprofit on G Street in Washington, holding what is genuinely hard to assemble: over 1 billion employer-sponsored claims a year covering more than 50 million lives, roughly one-third of the entire ESI population, multi-payer and longitudinal.
That asset could be a subscription product and largely is not. HealthPrices.org runs free against nearly 400 treatment services, and Health Care Vitals is free too.
The reports are free as well, licensed Creative Commons, and they come at a real clip: five since June, on vertical integration, spending by age, California county-level price variation, medications for opioid use disorder, and imaging spend.
Researchers apply through a Data Access Hub for the claims themselves, and the commercial tier exists for buyers who do not qualify. The published analysis carries no gate at all.
For a revenue-cycle department, that is a benchmark you can cite in a room without a procurement cycle attached to it.
Final Thoughts
The timing is not incidental. CMS has been extending site-neutral payment by regulation since 2021, when E&M went first, and added IV drug infusion in 2026.
The CY 2027 OPPS proposed rule, out July 2 and effective January 1 if it survives, proposes paying physician-fee-schedule-equivalent rates for imaging without contrast at excepted off-campus provider-based departments: APCs 5521 through 5524, plus 8004, 8005, and 8007. Comments on that proposal drew the objection you would expect from the hospital field.
So a brief that measures how far imaging has already migrated lands while the agency is deciding what to pay for it, and the estimate the brief cites for a broader site-neutral policy is $153 billion in Medicare savings over ten years against $94 billion off beneficiary premiums and cost sharing.
Independent evidence showing up in the record at the moment the record is open is not the normal rhythm of health policy research. Worth knowing who produced it, and worth knowing it cost you nothing to read.
Thanks for reading.