 Downcoded
Which Line in Medicaid's New Match Table Isn't Arithmetic?
HHS filed next year's federal match rates at 8:45 this morning, one line for every state, DC and territory. The income formula moved 40 states and the widest move it produced was 3.6 points. Puerto Rico's line moved 21, because a clause in the 2023 appropriations law runs out on September 30, 2027 and the statutory default underneath it reads 55 percent.
Once a year HHS prints a table with one line for every state, DC and territory, and almost nobody opens it. This year's went on public inspection at 8:45 this morning.
It sets the federal match on most of what a state's Medicaid program spends between October 1, 2027 and September 30, 2028.
Fifty-five of the fifty-six rows moved less than four points. One moved 21 (chart below).
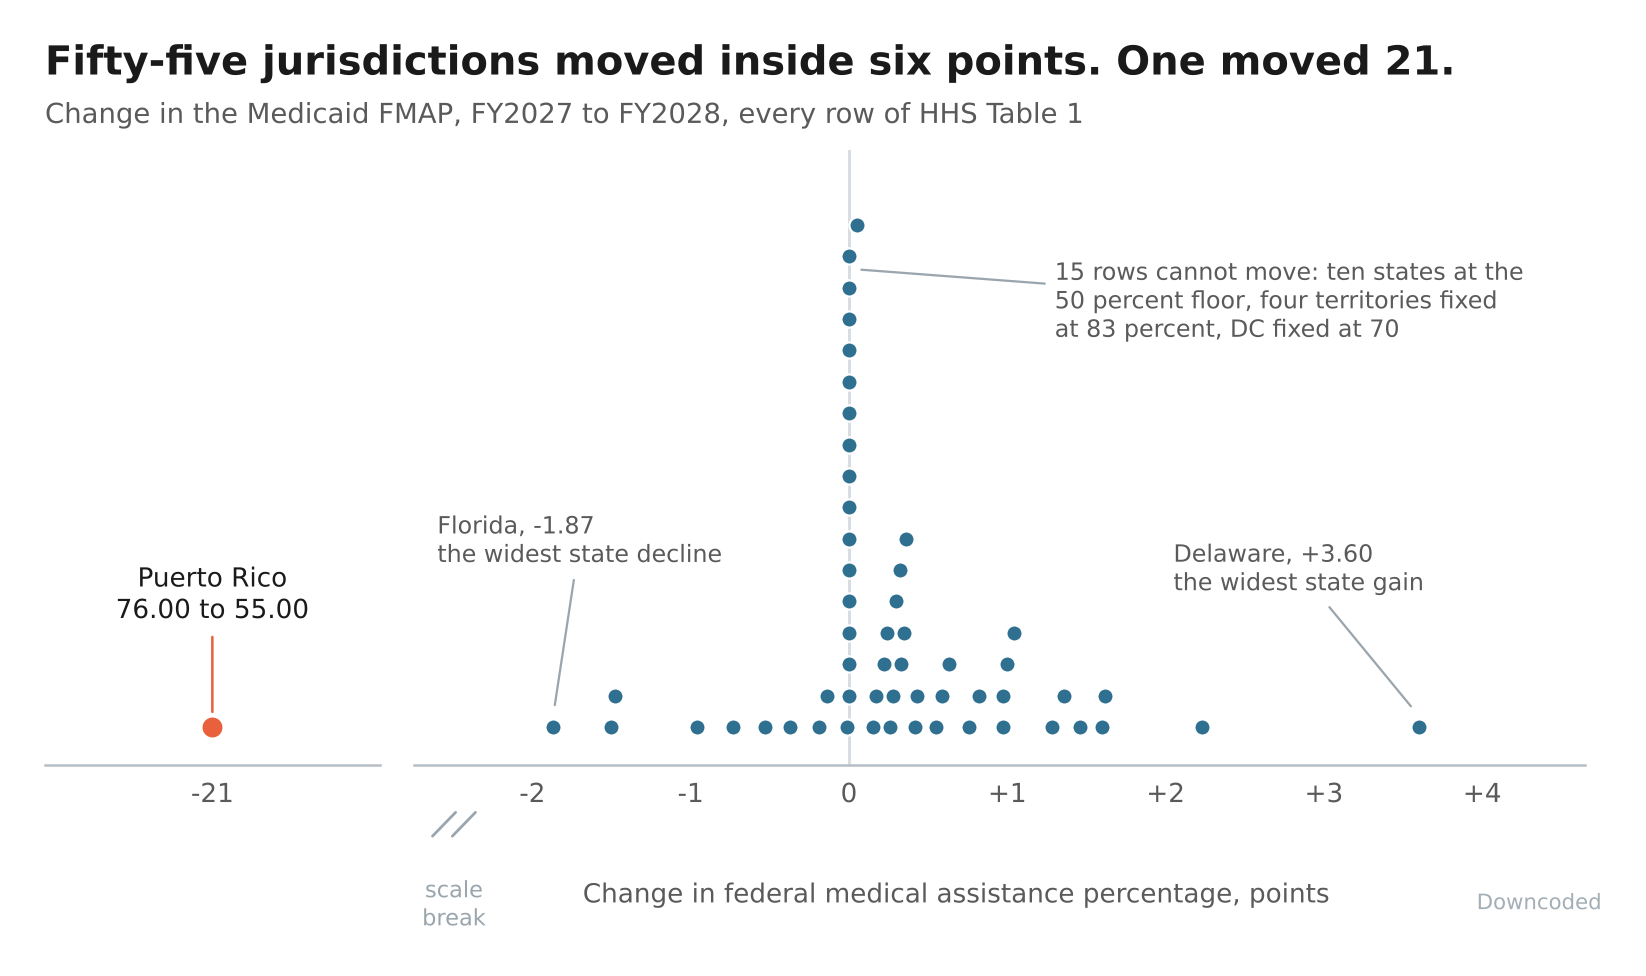
"What moves a Medicaid match rate 21 points in a single year?"
Nothing in the formula. That rate ran out.
The Fifty-Five That Are Arithmetic
The notice quotes the statute it ran.
A state's FMAP is 100 less its state percentage, and the state percentage bears the same ratio to 45 percent as the square of that state's per capita income bears to the square of the national figure. Floor 50, ceiling 83.
Square the ratio and small income moves get amplified, which is why the table reshuffles every November and why almost nobody's number is round.
For FY2028, 30 of the 50 states gained match and 10 lost it.
The other ten did not move at all. They are sitting on the 50 percent floor, and the floor does not care what their income did: California, Colorado, Connecticut, Maryland, Massachusetts, New Hampshire, New Jersey, New York, Washington and Wyoming.
Virginia came within 17 hundredths of a point of joining them, at 50.17.
The movers worth writing down:
- Florida, 55.43 to 53.56. Down 1.87, the widest state decline in the table.
- Missouri, 64.58 to 63.08 and Hawaii, 58.39 to 56.91. The only other states losing more than a point.
- Delaware, 60.33 to 63.93. Up 3.60, the widest move in either direction that the formula produced anywhere.
Each of those points is a point of every matched dollar the program spends, moving between a state treasury and the federal one. End to end, the fifty-state band is 5.47 points wide.
The One That Isn't
Puerto Rico's row reads 55.00.
Last November's notice read 76.00, and CRS has it at 76 every year back to FY2023. The 76 percent was never a calculation. Section 5101(b) of the Consolidated Appropriations Act, 2023 wrote it into section 1905(ff) with an expiration date on it, and this morning's notice prints that date in its own footnote: the rate is 76 percent "through September 30, 2027," and "[b]eginning October 1, 2027, the FMAP for Puerto Rico will be 55 percent under section 1905(b)(2) of the Act."
Section 1905(b)(2) is the default underneath, and it reads 55 percent for the territories. The enhanced rate was the temporary thing sitting on top of it.
Note what did not happen to the four other territories. American Samoa, Guam, the Northern Mariana Islands and the Virgin Islands read 83.00 again, because the same 2023 law made their rate permanent and left Puerto Rico's on a clock.
What 21 Points Costs
Puerto Rico's Medicaid runs under a capped federal allotment, so the match rate and the ceiling work against each other.
The FY2027 ceiling is $3,825,000,000, written into 42 U.S.C. 1308(g)(11).
At a 76 percent match, drawing all of it takes $5.03 billion of total program spending, of which Puerto Rico's own share is $1.21 billion.
At 55 percent, drawing that same $3.825 billion takes $6.95 billion of spending and $3.13 billion of local money. Same federal ceiling, 2.59 times the local cost of reaching it.
Run it the other way and hold spending flat at the FY2027 shape: the federal share drops to $2.77 billion, and Puerto Rico picks up the $1.06 billion difference. At which point the ceiling stops binding at all, because there is a billion dollars of headroom under it the program cannot afford to claim.
That is arithmetic on the statutory ceiling, not a forecast of what the island actually spends. The direction is the part that holds: local cents per matched dollar go from 24 to 45, an 87.5 percent increase in the share Puerto Rico funds itself.
And the ceiling reverts on the same morning.
1308(g)(11) names a dollar figure for FY2023 through FY2027 and then stops naming one. FY2028 is computed off the pre-2020 growth path instead, which CRS describes as "significantly reduced."
Final Thoughts
Congress has caught this before. The FY2023 through FY2027 schedule now sitting in the statute is itself the last catch, and there were catches before that one.
So a 55.00 printed in November 2026 is not a prediction about October 2027. It is ten months of written warning, filed where almost nobody looks.
What makes the rest of the table worth the ten minutes is the contrast on the chart. The income formula moved forty states this year and the widest result it managed was 3.60 points.
One sunset clause moved a jurisdiction 21.
If you are trying to work out where a Medicaid budget bends next, the per capita income data is the small variable, and the expiration dates are the big one.
Thanks for reading.