Your A/R Days Are the One Thing That Held Still
We ran days in A/R and days of cash on the same 3,598 hospital balance sheets for five straight fiscal years, straight out of Medicare's own cost report files. The revenue-cycle number moved a fifth of a day. The cash number lost 17.7. And the receivable sitting above the national median adds up to $70 billion.
Every vendor deck that reaches your inbox opens on the same number.
Days in A/R. Yours is too high, their clients' is lower, and the gap is the entire pitch.
So we measured it, and not off a survey or a consortium you have to join to see.
Medicare already holds the answer. A hospital that files a cost report files its balance sheet with it, and that balance sheet carries the receivable on one line and the cash on another.
We pulled the five most recent CMS Hospital Provider Cost Report final files, took the 3,598 hospitals usable in all five, and ran two ratios on each: days in net accounts receivable, and days of cash on hand.
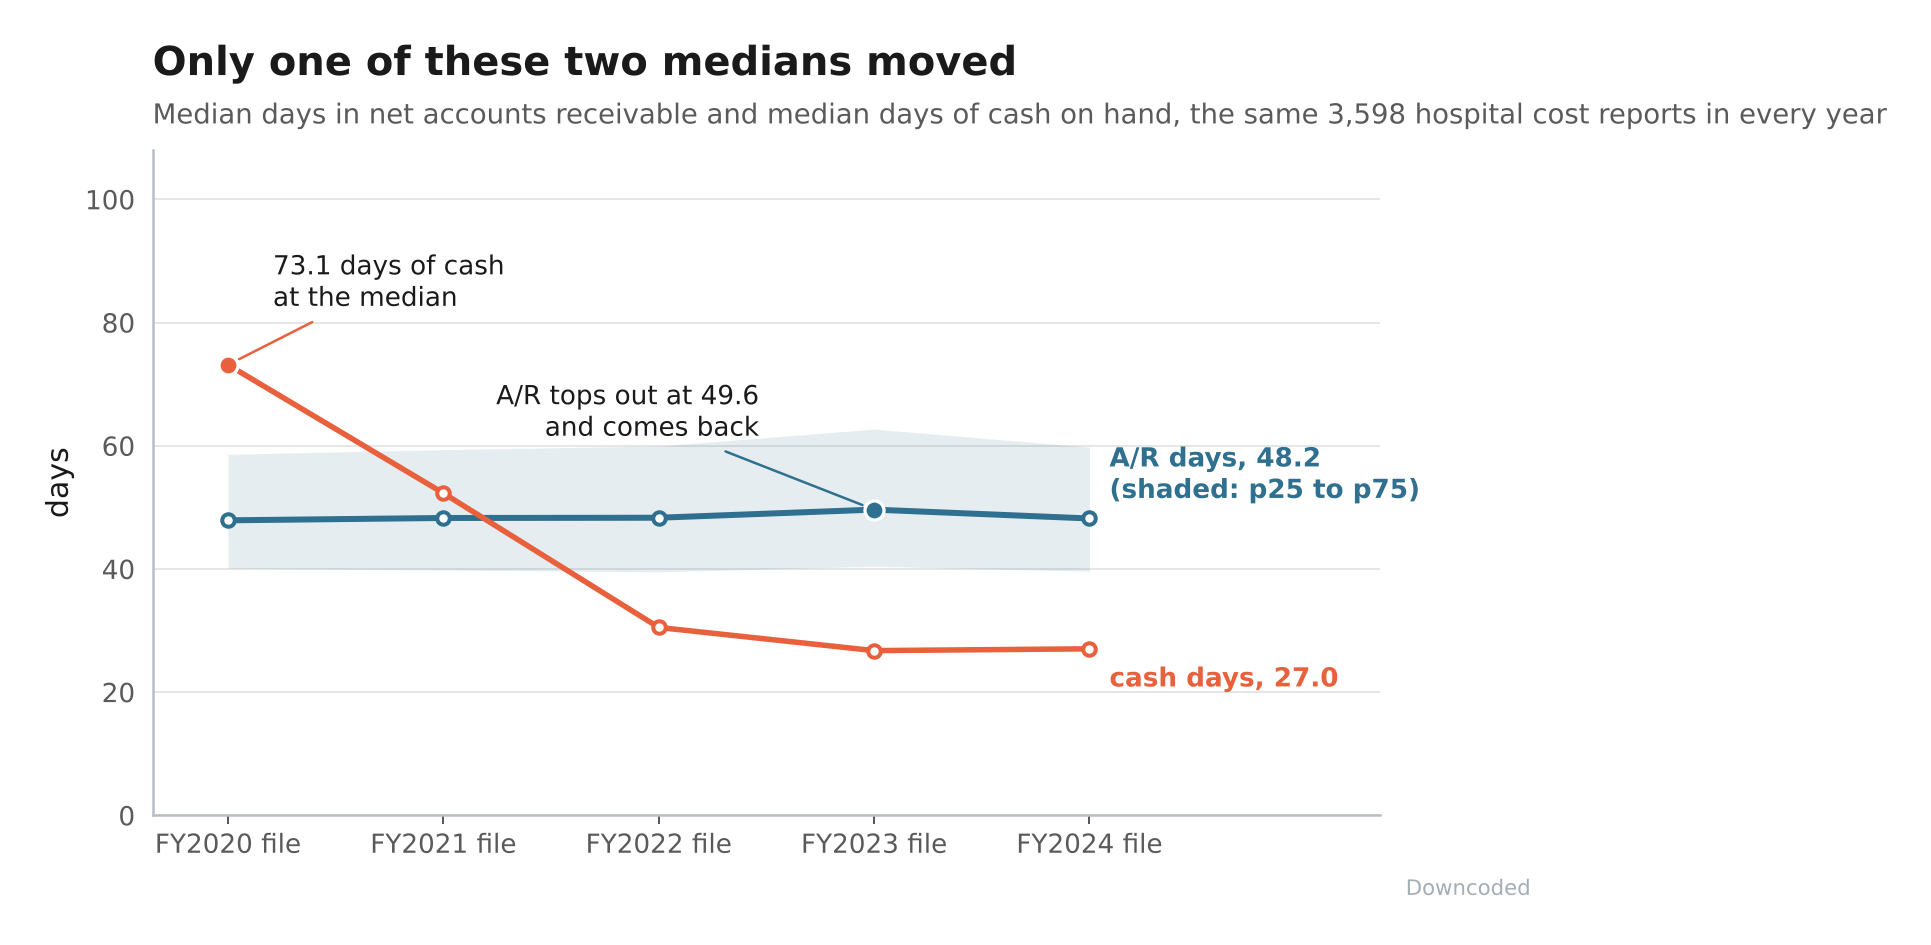
Only one of the two moved (chart below).
A Fifth of a Day, in Five Years
The A/R median across that fixed population runs 47.9, then 48.3, 48.3, 49.6, and back to 48.2. The first and third quartiles sit on the same rails the whole way, roughly 40 and 60.
Pair each hospital against itself, 2020 file to 2024 file, and the median change is +0.21 days. Half the field got worse, half got better, which is another way of saying nothing happened.
Swap the denominator to gross charges and the flatline holds there too: 16.8 days in 2020, 16.8 in 2024.
Now the other line. Median days of cash went 73.1 to 27.0, and the paired change on the same hospitals is -17.68 days, with 74.5% of them ending lower than they started.
Two honest limits there. A hospital inside a system can hold its cash at the parent and file a nearly empty Worksheet G, which is why we read that line as a direction on a fixed panel and never as a level.
And the relief money and the accelerated-payment recoupment both land inside this window. CMS set that recoupment at 25% of payments owed for eleven months, rising to 50% for six more, 29 months in all.
This file cannot tell you how much of the fall is which, and we are not going to pretend otherwise.
What the file does say is that the squeeze did not come out of your receivable.

The rest of this brief is for subscribers.
The impact tables, the code-level detail, and the rest of the analysis sit past this line.
$50 a month, or $500 a year.
Already a subscriber? Sign in