 Downcoded
Sage Transparency Already Has Your Hospital's Number
An employer coalition in Indiana commissioned RAND in 2016 to find out what private plans actually pay hospitals, and has been publishing the answer per facility, for free, ever since. The current edition prices 4,000-plus hospitals against Medicare across 49 states and DC. Enrollment for the next round, built on 2023 through 2025 claims, closes before November.
In 2016 an employers' coalition in Indiana hired RAND to answer a question the market could not answer with a document: what do private health plans actually pay hospitals?
The first study came out in 2017. More followed in 2019, 2020 and 2022, each one built from the claims that self-funded employers already owned and had never pooled.
Then in 2022 the Employers' Forum of Indiana put the results into a public dashboard called Sage Transparency, and stopped charging anyone to look.
"What does this hospital get paid by everyone who isn't Medicare, and how would I know?"
Ten Years of Somebody Else's Claims
The mechanism is straightforward and the reason it works is that it runs on data the participants already hold.
Self-funded employers, business coalitions and state all-payer claims databases contribute their hospital claims. RAND standardizes them, prices every service against what Medicare would have paid the same facility, and publishes the ratio.
That ratio is the relative price, and it is the whole product. One number, per hospital, comparable across state lines, on a denominator every revenue-cycle department already knows how to compute.
The current edition is Round 5.1, released December 10, 2024. It covers $80.2 billion of hospital spending and $3.1 billion of ambulatory surgery center spending across more than 4,000 hospitals in 49 states and the District of Columbia, drawing on 2020 through 2022 claims and twelve state APCDs.
The sample is about 6% of commercial hospital spending nationally. Small, and large enough that most facilities of any size have a published number.
The Number That Travels
Here is the part worth knowing before someone quotes it at you.
The headline is a single figure, 254% of Medicare for combined inpatient and outpatient facility services in 2022. Underneath it the number splits three ways, and the split is where the argument actually lives (chart below).
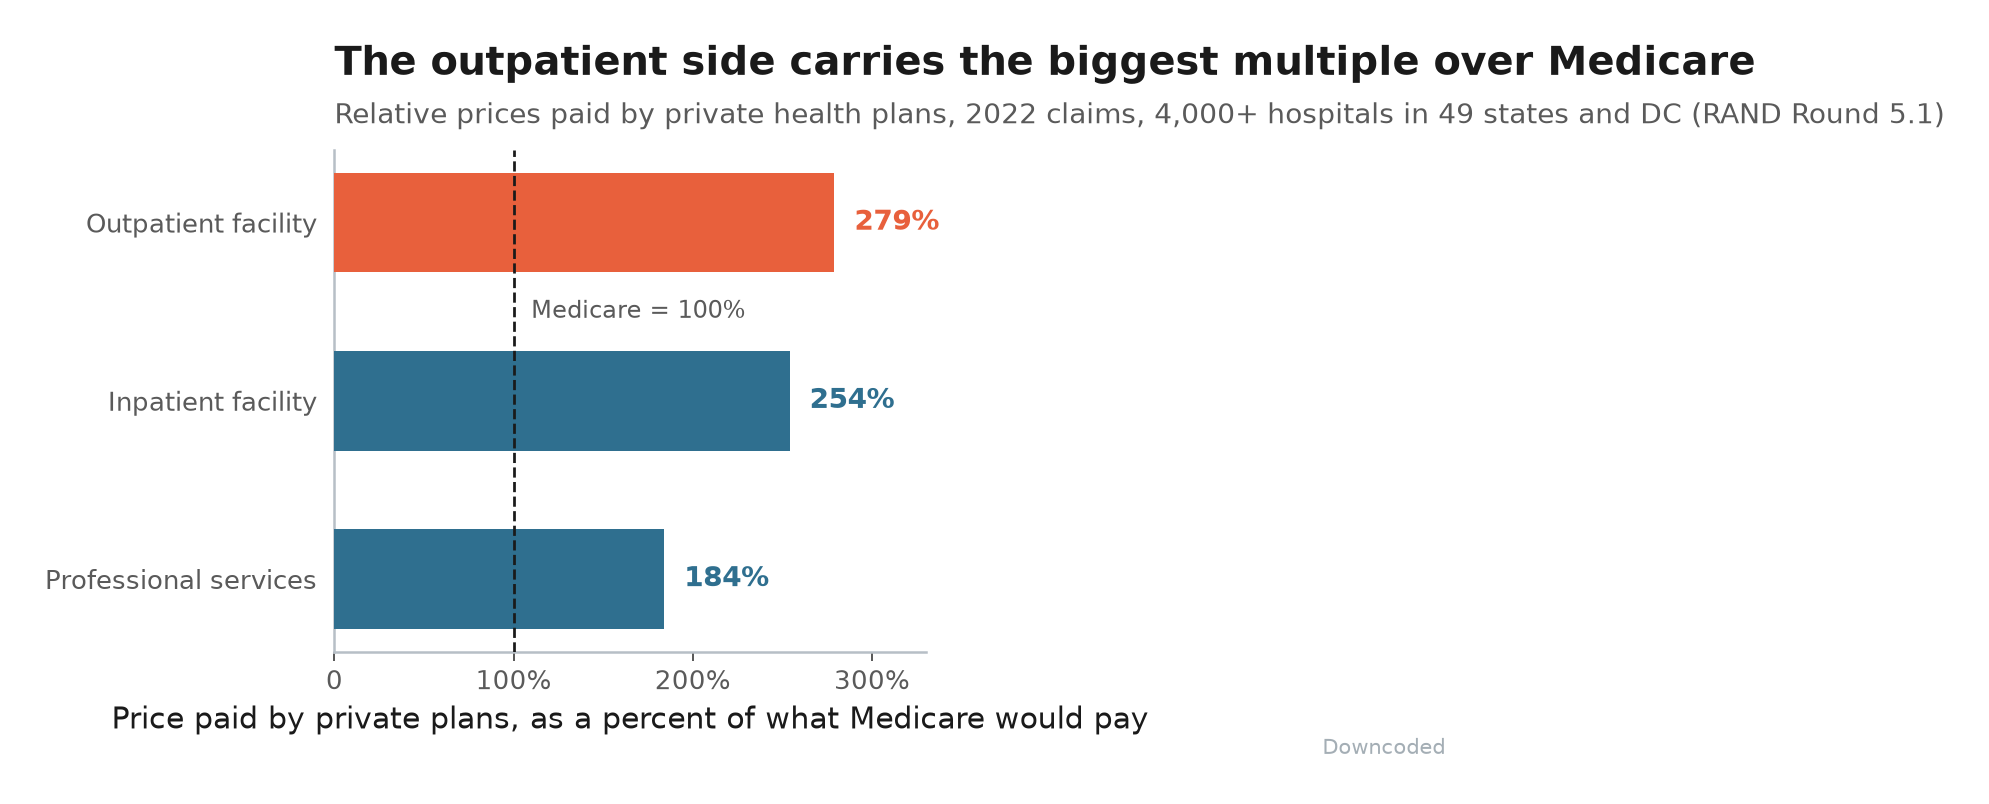
Outpatient facility services came in at 279% of Medicare, inpatient facility at 254%. Professional services at 184%.
That is a 95-point spread between the outpatient facility side and the professional side inside the same framework. A system-wide average quoted across a negotiating table hides all of it.
State variation is wider still.
Arkansas, Massachusetts, Michigan, Mississippi and Rhode Island landed below 200% in 2022. California, Delaware, Florida, Georgia, New York, South Carolina, West Virginia and Wisconsin landed above 300%.
Round 5.1 was published in Rand Health Quarterly on March 17, 2025, so the methodology is on the record and readable rather than sitting behind a vendor's summary slide.
What Else Is on the Dashboard
Sage Transparency is not only the RAND price file. It pulls the NASHP Hospital Cost Tool, January Advisors, Quantros and Healthcare Bluebook quality data, and CMS, into one browser view.
What that gets you per facility:
- Relative price as a percent of Medicare, the RAND number
- Commercial break-even, the estimate of what commercial payment would have to be for the facility to cover cost
- Operating profit margin
- CMS star ratings across mortality, safety of care, readmission, patient experience, and timely and effective care
- Patient experience scores alongside the price, on the same screen
Ambulatory surgery center prices and physician-administered medication prices are in there too, which matters if your service-line strategy involves either.
The underlying sources are queried once a quarter and refreshed when the upstream file moves. The most recent data update was May 5, 2026.
Round Six Is Being Assembled Right Now
This is the part with a date on it.
PT6, the sixth round, is open for enrollment. Employers, health plans, business coalitions, all-payer claims databases and any other organization sitting on employer hospital claims can contribute, and enrollment agreements have to be signed before November 2026.
Per the RAND project page, Round 6 is sponsored by Arnold Ventures, runs on 2023 through 2025 claims, and is expected to publish in September 2027. Public reports do not name the employers, plans or TPAs that supplied the data.
So the contracts being negotiated this quarter land in the public record, in aggregate, in roughly a year and a half. The 2023 through 2025 window is already closed on the claims side; what is still open is who contributes them.
Final Thoughts
The useful thing about a free public benchmark is not that it is right in every cell. It is that everyone on the other side of your contract can already see it, and the ones who have looked will open with it.
Ten years in, this project has done something the enterprise data vendors have not, which is publish the number and let anyone check the arithmetic. Whatever you think of 254%, it is a figure with a method attached, in a journal, updated quarterly, and free.
Look up your own facilities before the next renewal conversation does it for you.
Thanks for reading.