 Downcoded
The Prior Auth Registry Nobody Was Required to Build
CMS-0057-F made 1,378 health plans post their CY2025 prior authorization numbers on their own websites and created nowhere to put them. An independent site has collected 1,276 of those filings, plan by plan, with the source document behind every record. We tested its UnitedHealthcare entries against the filing we parsed ourselves last week.
Every Medicare Advantage organization, Medicaid and CHIP managed care plan, state fee-for-service program and federally facilitated marketplace issuer had to publish its calendar year 2025 prior authorization numbers by March 31.
Approval rates, denial rates, the share approved after appeal, mean and median time to determination. Posted on its own website, in its own format, at the contract level, under 42 CFR 422.122(c) and its Medicaid and exchange counterparts.
CMS built no place to put any of it. There is no federal repository of the filings, and there is no federal list of who had to file.
Somebody went and assembled both anyway.
What It Actually Holds
AuthDenied has been collecting these disclosures since the deadline. As of its August 4 dataset it carries 1,276 plan records against a filer universe it inventoried itself at 1,378, across all fifty states, DC and Puerto Rico.
Each record is the filing, parsed: standard and expedited request volumes, approval and denial counts, appeal overturn rates, decision turnaround, and the source URL of the document it came from. The methodology page is blunt about the boundary: "The site does not estimate, infer, or fill in missing values."
Totals across the collected set run 86.4 million requests reported at an 11.5% denial rate, with the middle 90% of plans landing between 2% and 27%.
The program gradient is the part your contracting team will want. Medicare Advantage averages 8.9% denied, Medicaid 13.4%, marketplace plans 15.1%.
In July the site published a twelve-page brief on the first reporting year, built on 1,143 disclosures, and the finding worth stealing is the appeals gap: at the median plan 7.3% of denials were appealed and 52.6% of appealed denials were overturned. At one plan in three, most appeals succeeded while fewer than one denial in ten was ever filed.
We Checked It Against a Filing We Read Ourselves
Last Monday this desk pulled UnitedHealthcare's own Medicare Advantage filing, sixty-three H-contracts, and parsed the tables out of the PDF. That makes for a clean test of somebody else's copy.
Take H0543, the California-only HMO. AuthDenied publishes 1.8% denied on standard requests, 82.3% of appealed denials overturned, and 0.0 days to a standard decision.
UnitedHealthcare's filed standard row for that contract: 1,569,659 requests, 27,521 not approved, 385 approved post-appeal at 82.3% of appeals, mean time to determination 0 days. All three match the source exactly.
The 0.0 days is the mean the payer filed against a 2.4-day median in the same row, and the site carries the filed number rather than a tidier substitute. That is the whole design promise working.
The July brief puts the standard denial range across the largest parent organization's Medicare Advantage contracts at "below 1 percent to 27.8 percent." Our independent parse of the filing gives 0.00% to 27.78%.
Same file, same endpoints, arrived at separately.
Where the Filings Still Aren't
Coverage is not even across the rule's five filer categories, and the hole is somewhere specific (chart below).
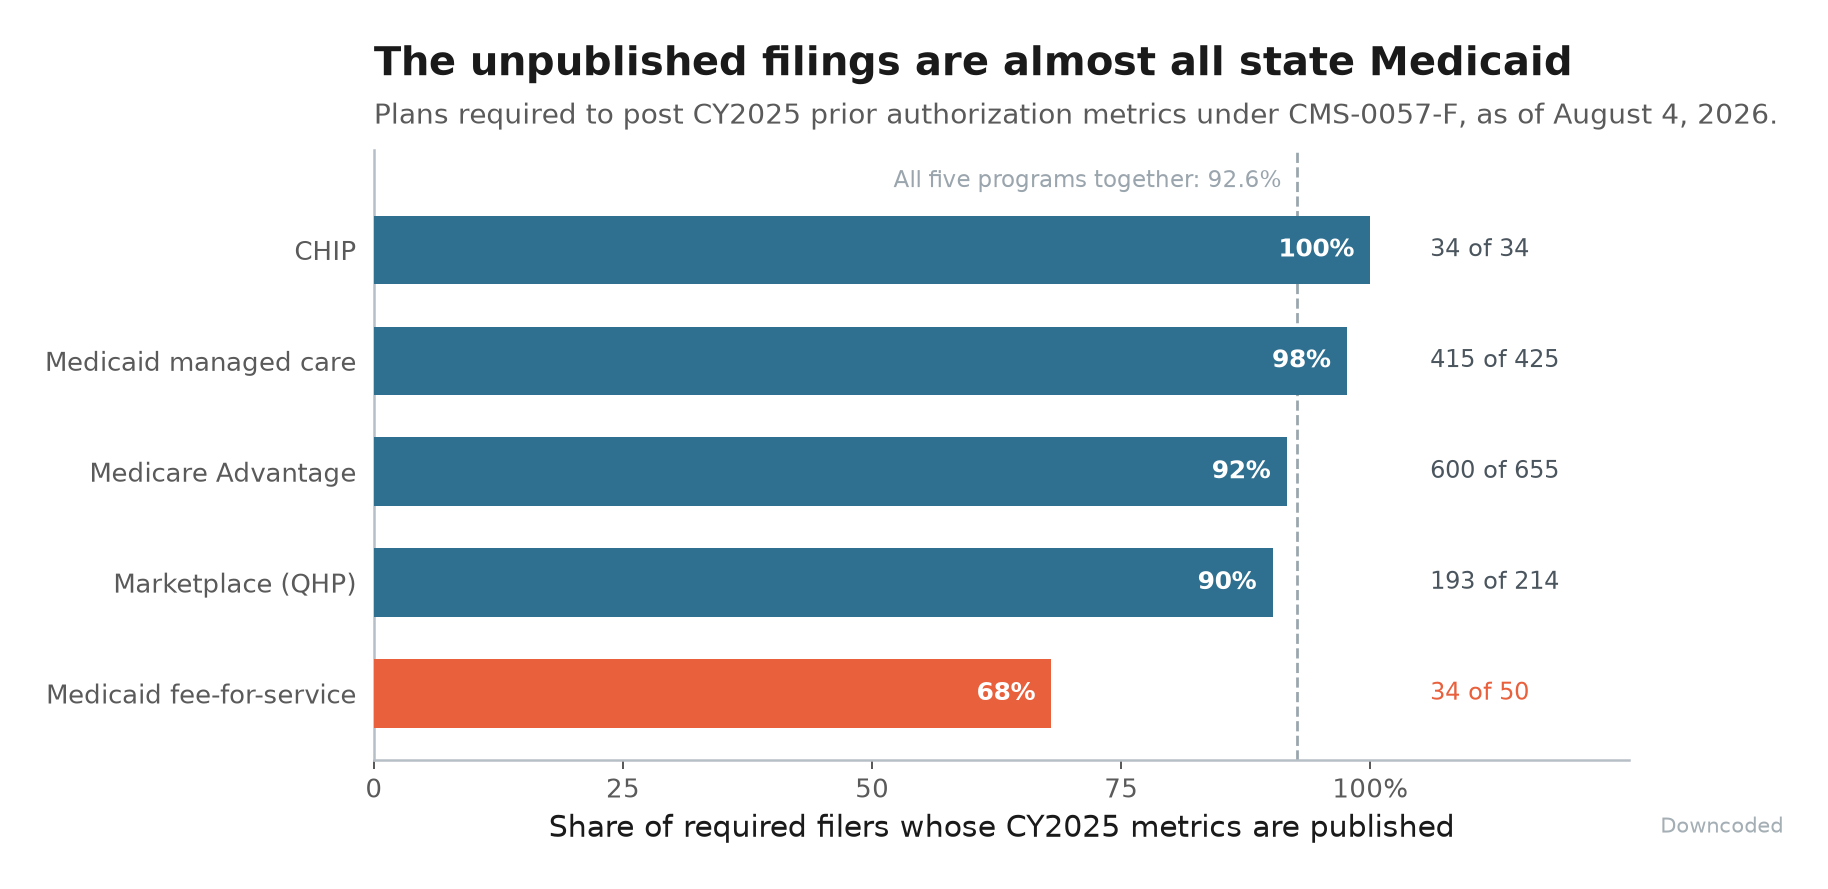
CHIP entities are at 34 of 34. Medicaid managed care is at 415 of 425 and Medicare Advantage at 600 of 655.
State Medicaid fee-for-service programs are at 34 of 50.
So roughly one state Medicaid program in three has posted nothing, five months past a deadline that applied to it the same as it applied to Humana. The site says as much in its own limitations section, which is more than most datasets do about their gaps.
If you bill a state FFS program and you have been waiting for its published denial rate to benchmark against, there is a real chance the number does not exist yet.
Which Number Belongs in the Deck
One usage note, because the site publishes two different constructions and both are correct for different jobs.
Plan records are the filing, verbatim. Organization-level averages are unweighted means over per-state plan records, and national contracts get split into one record per state, so a contract reporting in fifty-two jurisdictions lands in that average fifty-two times.
That is the right unit for a patient picking a plan in one state, which is who the site is built for. It is not the right unit for characterizing a payer's book.
For this organization the site's Medicare Advantage figure is 17.4%. Summing the filed counts across all sixty-three contracts gives a volume-weighted standard denial rate of 13.46%.
Both are arithmetic on the same disclosures.
Quote the plan record when you are benchmarking a contract. Compute from the filing when you are describing a book.
Final Thoughts
The rule that produced all of this is fundamentally a posting requirement, and posting requirements have a long history of producing documents nobody ever reads together. Hospital machine-readable files went the same way for two years.
What is different here is that the assembly work got done by someone with no obligation to do it, no funding from anyone in the transaction, and a published methodology anyone can argue with. The site says it takes no insurer or vendor money and carries no advertising, and it names its sources on every record so you can go check.
That last part is the part that matters. A number you can trace back to the payer's own PDF is worth more than a number with a logo on it, and for the first year of this rule somebody did the tracing for 1,276 plans.
Thanks for reading.